PROTECTED SOURCE SCRIPT
已更新 Otekura Range Trade Algorithm [Chain Hood]
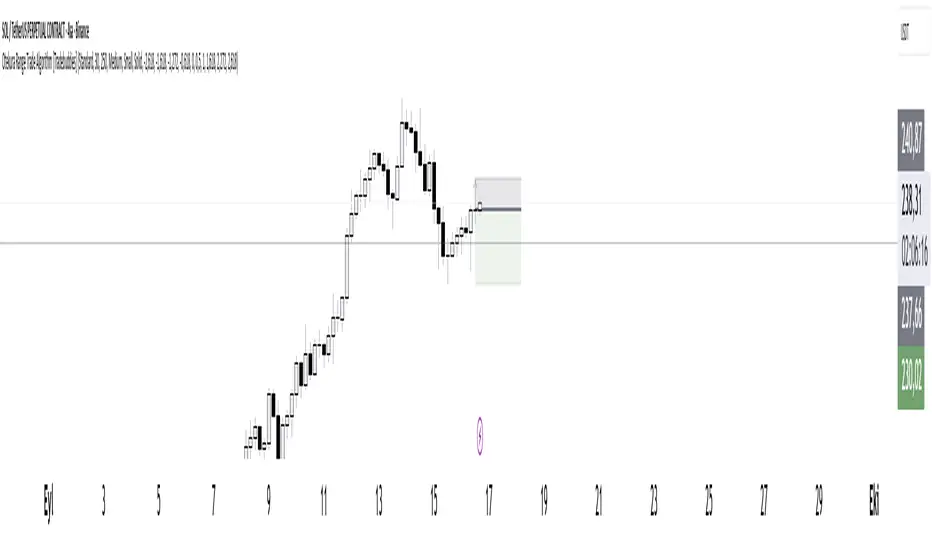
The Range Trade Algorithm calculates the levels for Monday.
On the chart you will see that the Monday levels will be marked as 1 0 -1.
The M High level calculates Monday's high close and plots it on the screen.
M Low calculates the low close of Monday and plots it on the screen.
The coloured lines on the screen are the points of the range levels formulated with fibonacci values.
The indicator has its own Value table. The prices of the levels are written.
Potential Range breakout targets tell prices at points matching the fibonacci values. These are Take profit or reversal points.
Buy and Sell indicators are determined by the range breakout.
Users can set an alarm on the indicator and receive direct notification with their targets when a new range occurs.
Fib values are multiplied by range values and create an average target according to the price situation. These values represent an area. Breakdown targets show that the target is targeted until the area.
版本注释
.受保护脚本
此脚本以闭源形式发布。 但是,您可以自由使用,没有任何限制 — 了解更多信息这里。
免责声明
这些信息和出版物并非旨在提供,也不构成TradingView提供或认可的任何形式的财务、投资、交易或其他类型的建议或推荐。请阅读使用条款了解更多信息。
受保护脚本
此脚本以闭源形式发布。 但是,您可以自由使用,没有任何限制 — 了解更多信息这里。
免责声明
这些信息和出版物并非旨在提供,也不构成TradingView提供或认可的任何形式的财务、投资、交易或其他类型的建议或推荐。请阅读使用条款了解更多信息。