OPEN-SOURCE SCRIPT
已更新 Multi-Timeframe Highs and Lows
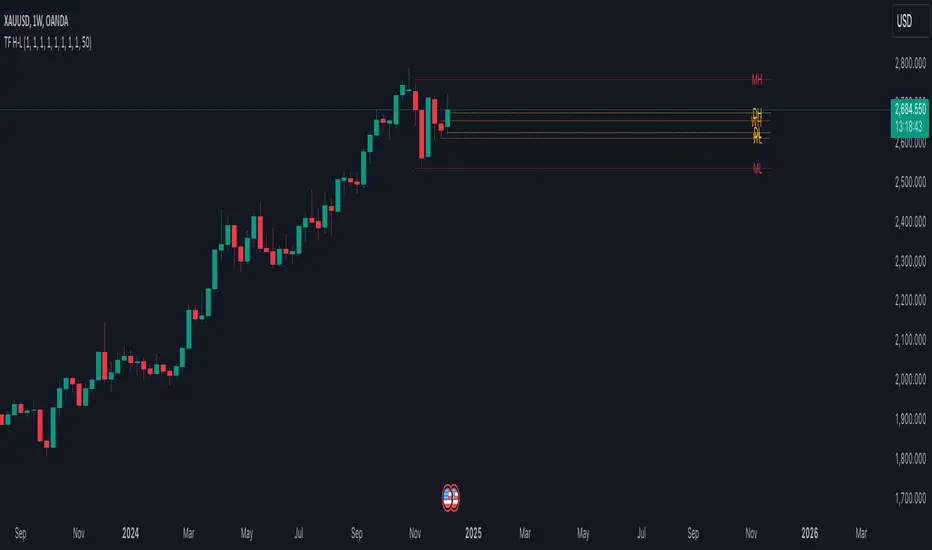
The "Multi-Timeframe Highs and Lows" indicator is a comprehensive tool designed to plot recent Highs and Lows across multiple timeframes, including 15-Minute, 30-Minute, 1-Hour, 4-Hour, 8-Hour, Daily, Weekly, and Monthly. This indicator provides traders with a clear view of critical support and resistance levels, enabling precise decision-making for entries, exits, and stop-loss placements. It features customizable lookbacks, dynamic line extensions, and advanced label placement logic to prevent overlap, ensuring a clean and clutter-free chart. With fully customizable colors and styles for each timeframe, traders can tailor the indicator to their preferences. Whether you’re a scalper, swing trader, or position trader, this tool adapts to your strategy, providing actionable insights for breakout, reversal, and trend-following setups. Optimized for performance, it handles multiple lines and labels efficiently, making it suitable for high-activity charts. The "Multi-Timeframe Highs and Lows" indicator is an indispensable tool for traders seeking to identify and utilize key price levels across all timeframes with precision and clarity.
版本注释
OverviewThe Multi-Timeframe Highs & Lows (MTF H-L) indicator is a versatile tool designed for traders who seek to monitor and analyze significant price levels across multiple timeframes. By plotting the highs and lows of selected timeframes directly on your chart, this indicator provides a comprehensive view of key support and resistance levels, enhancing your technical analysis and trading strategies.
Key Features
Multi-Timeframe Analysis: Monitor highs and lows across various timeframes including 15 minutes, 30 minutes, 1 hour, 4 hours, 8 hours, Daily, Weekly, and Monthly.
版本注释
OverviewThe TF Highs & Lows (TF H-L) indicator is a versatile tool designed for traders who seek to monitor and analyze significant price levels across multiple timeframes. By plotting the highs and lows of selected timeframes directly on your chart, this indicator provides a comprehensive view of key support and resistance levels, enhancing your technical analysis and trading strategies.
Key Features
- Multi-Timeframe Analysis: Monitor highs and lows across various timeframes including 15 minutes, 30 minutes, 1 hour, 4 hours, 8 hours, Daily, Weekly, and Monthly.
- Customizable Lookback Period: Analyze historical highs and lows by setting a lookback period (from 1 to 100 candles) for each timeframe, allowing you to review significant levels over your desired number of past candles.
- Flexible Timeframe Selection: Enable or disable any of the available timeframes based on your trading needs, ensuring a clutter-free and focused chart view.
- Visual Customization: Customize the color of high and low lines for each timeframe, adjust the right extension of lines (in bars), and manage label placements to suit your visual preferences.
- Efficient Label Management: Automatically handles label placement to prevent overlaps, ensuring clear and readable annotations on your chart.
- Invisible Data Plots: Includes hidden plots for the data window, enabling seamless integration with other indicators and ensuring that your chart remains clean and uncluttered.
Inputs and Customizations: Indicator Settings
Timeframe Selection
- 15M: Enable/disable monitoring of 15-minute timeframe.
- 30M: Enable/disable monitoring of 30-minute timeframe.
- 1H: Enable/disable monitoring of 1-hour timeframe.
- 4H: Enable/disable monitoring of 4-hour timeframe.
- 8H: Enable/disable monitoring of 8-hour timeframe.
- Daily: Enable/disable monitoring of Daily timeframe.
- Weekly: Enable/disable monitoring of Weekly timeframe.
- Monthly: Enable/disable monitoring of Monthly timeframe.
Lookback Periods:
- 15M Lookback: Set the number of past 15-minute candles to analyze.
- 30M Lookback: Set the number of past 30-minute candles to analyze.
- 1H Lookback: Set the number of past 1-hour candles to analyze.
- 4H Lookback: Set the number of past 4-hour candles to analyze.
- 8H Lookback: Set the number of past 8-hour candles to analyze.
- Daily Lookback: Set the number of past Daily candles to analyze.
- Weekly Lookback: Set the number of past Weekly candles to analyze.
- Monthly Lookback: Set the number of past Monthly candles to analyze.
Style Settings:
- Right Extension (bars): Define how far to extend the high and low lines to the right of the chart (minimum 1 bar).
- Line Colors: Customize the colors for each timeframe’s high and low lines to enhance visual differentiation.
开源脚本
秉承TradingView的精神,该脚本的作者将其开源,以便交易者可以查看和验证其功能。向作者致敬!您可以免费使用该脚本,但请记住,重新发布代码须遵守我们的网站规则。
免责声明
这些信息和出版物并非旨在提供,也不构成TradingView提供或认可的任何形式的财务、投资、交易或其他类型的建议或推荐。请阅读使用条款了解更多信息。
免责声明
这些信息和出版物并非旨在提供,也不构成TradingView提供或认可的任何形式的财务、投资、交易或其他类型的建议或推荐。请阅读使用条款了解更多信息。