OPEN-SOURCE SCRIPT
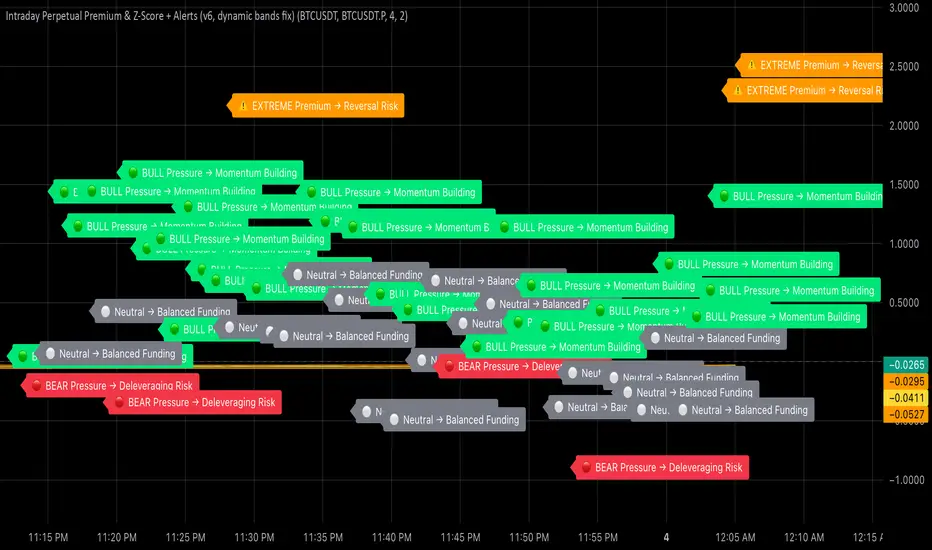
Intraday Perpetual Premium & Z-Score
This indicator measures the real-time premium of a perpetual futures contract relative to its spot market and interprets it through a statistical lens.
It helps traders detect when funding pressure is building, when leverage is being unwound, and when crowding in the futures market may precede volatility.
How it works
• Premium (%) = (Perp – Spot) ÷ Spot × 100
The script fetches both spot and perpetual prices and calculates their percentage difference each minute.
• Rolling Mean & Z-Score
Over a 4-hour look-back, it computes the average premium and standard deviation to derive a Z-Score, showing how stretched current sentiment is.
• Dynamic ±2σ Bands highlight statistically extreme premiums or discounts.
• Rate of Change (ROC) over one hour gauges the short-term directional acceleration of funding flows.
Colour & Label Interpretation
Visual cue Meaning Trading Implication
🟢 Green bars + “BULL Pressure” Premium rising faster than mean Leverage inflows → momentum strengthening
🔴 Red bars + “BEAR Pressure” Premium shrinking Leverage unwind → pull-back or consolidation
⚠️ Orange “EXTREME Premium/Discount” Crowded trade → heightened reversal risk
⚪ Grey bars Neutral Balanced conditions
Alerts
• Bull Pressure Alert → funding & premium rising (momentum building)
• Bear Pressure Alert → premium falling (deleveraging)
• Extreme Premium Alert → crowded longs; potential top
• Extreme Discount Alert → capitulation; possible bottom
Use case
Combine this indicator with your Heikin-Ashi, RSI, and MACD confluence rules:
• Enter only when your oscillators are low → curling up and Bull Pressure triggers.
• Trim or exit when Bear Pressure or Extreme Premium appears.
• Watch for Extreme Discount during flushes as an early bottoming clue.
开源脚本
秉承TradingView的精神,该脚本的作者将其开源,以便交易者可以查看和验证其功能。向作者致敬!您可以免费使用该脚本,但请记住,重新发布代码须遵守我们的网站规则。
免责声明
这些信息和出版物并非旨在提供,也不构成TradingView提供或认可的任何形式的财务、投资、交易或其他类型的建议或推荐。请阅读使用条款了解更多信息。
开源脚本
秉承TradingView的精神,该脚本的作者将其开源,以便交易者可以查看和验证其功能。向作者致敬!您可以免费使用该脚本,但请记住,重新发布代码须遵守我们的网站规则。
免责声明
这些信息和出版物并非旨在提供,也不构成TradingView提供或认可的任何形式的财务、投资、交易或其他类型的建议或推荐。请阅读使用条款了解更多信息。