PROTECTED SOURCE SCRIPT
FRL RSI-Divs
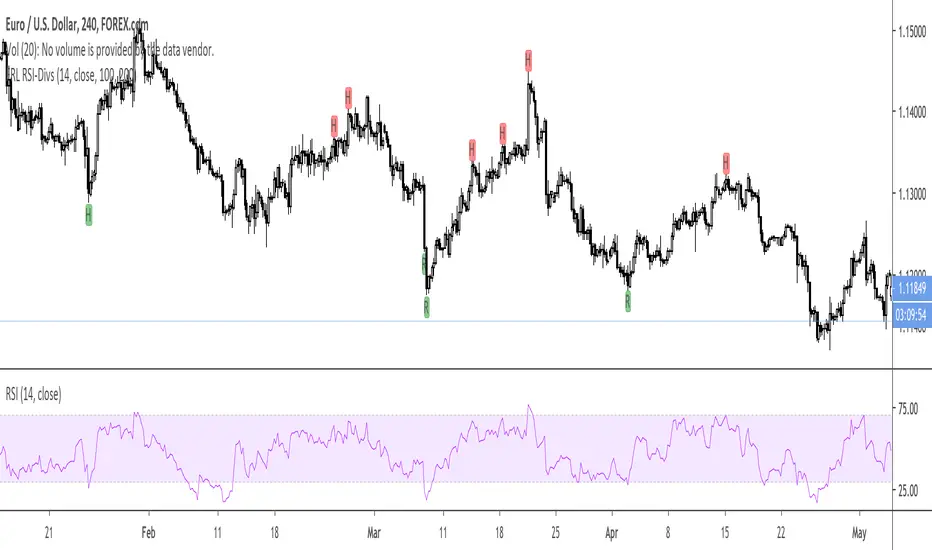
This indicator highlights RSI divergences.
R green label: Regular Bullish Divergence.
H green label: Hidden Bullish Divergence.
R red label: Regular Bearish Divergence.
H red label: Hidden Bearish Divergence.
You can choose the range where the Divergences should be looked for.
Bars Back Min should not be too low to avoid too many false positives.
I found that using a Min of 100 and a Max of 200 was giving decent results.
When a Divergence is found and printed, the value shown in the upper left corner is the number of bars back where the Divergence has been found, so you can check the validity.
受保护脚本
此脚本以闭源形式发布。 但是,您可以自由使用,没有任何限制 — 了解更多信息这里。
免责声明
这些信息和出版物并非旨在提供,也不构成TradingView提供或认可的任何形式的财务、投资、交易或其他类型的建议或推荐。请阅读使用条款了解更多信息。
免责声明
这些信息和出版物并非旨在提供,也不构成TradingView提供或认可的任何形式的财务、投资、交易或其他类型的建议或推荐。请阅读使用条款了解更多信息。