PROTECTED SOURCE SCRIPT
ASTA EMA (5, 13, 26, 50, 100, 200)
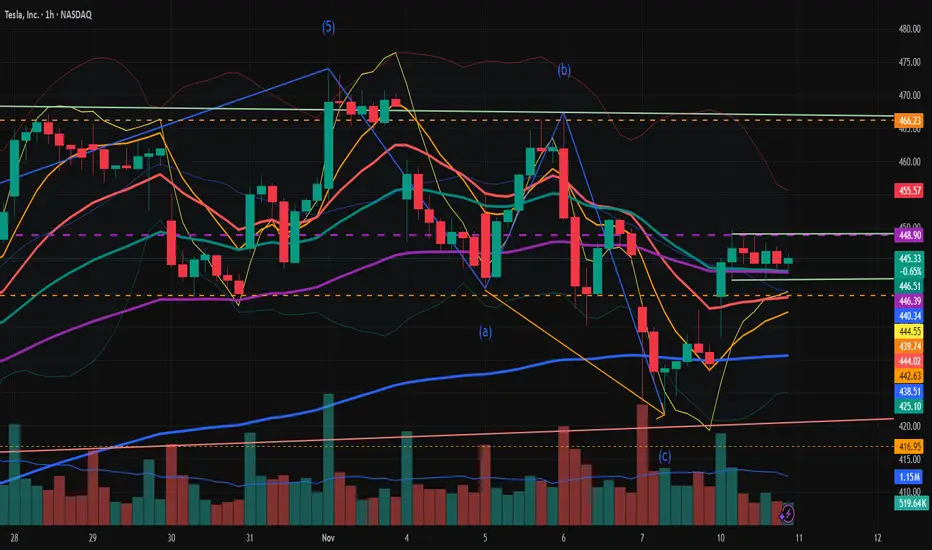
This indicator plots six Exponential Moving Averages (EMAs) — 5, 13, 26, 50, 100, and 200 — directly on the price chart. EMAs give more weight to recent price action, so they react faster than simple moving averages. Using multiple EMAs of varying lengths gives you both short-term and long-term trend information on a single chart:
Short EMAs (5, 13, 26) show rapid momentum and recent price direction.
Medium EMAs (50, 100) show intermediate trend context.
Long EMA (200) shows the major, long-term trend.
This setup is useful for trend identification, momentum signals, dynamic support/resistance, and crossover-based entry/exit signals.
受保护脚本
此脚本以闭源形式发布。 However, you can use it freely and without any limitations – learn more here.
免责声明
The information and publications are not meant to be, and do not constitute, financial, investment, trading, or other types of advice or recommendations supplied or endorsed by TradingView. Read more in the Terms of Use.