OPEN-SOURCE SCRIPT
已更新 VSA Signals [odnac]
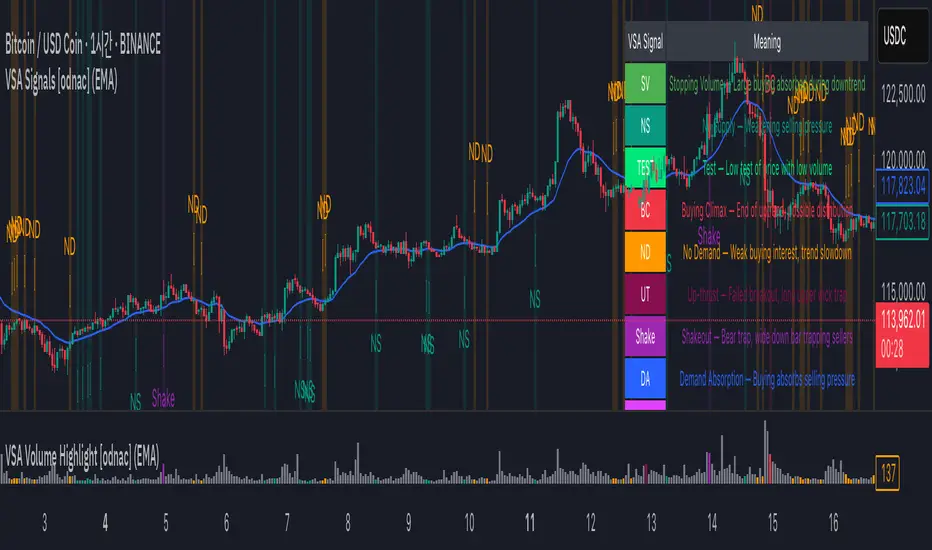
This indicator applies Volume Spread Analysis (VSA) concepts to highlight important supply and demand events directly on the chart. It automatically detects common VSA patterns using price spread, relative volume, and candle structure, with optional trend filtering for higher accuracy.
Features:
Additional Options:
This tool is designed to help traders spot professional accumulation and distribution activity and to improve trade timing by recognizing supply/demand imbalances in the market.
Features:
- Stopping Volume (SV): Signals potential end of a downtrend when heavy buying appears.
- Buying Climax (BC): Indicates exhaustion of an uptrend with heavy volume near the top.
- No Supply (NS): Weak selling pressure, often a bullish sign in an uptrend.
- No Demand (ND): Weak buying interest, often a bearish sign in a downtrend.
- Test: Low-volume test bar probing for supply.
- Up-thrust (UT): Failed breakout with long upper wick, often a bearish trap.
- Shakeout: Bear trap with high-volume wide down bar closing low.
- Demand Absorption (DA): Demand absorbing heavy selling pressure.
- Supply Absorption (SA): Supply absorbing heavy buying pressure.
Additional Options:
- Background highlights for detected signals.
- Configurable moving average (SMA, EMA, WMA, VWMA) as a trend filter.
- Adjustable multipliers for volume and spread sensitivity.
- Legend table for quick reference of signals and meanings.
- Alerts available for all signals.
This tool is designed to help traders spot professional accumulation and distribution activity and to improve trade timing by recognizing supply/demand imbalances in the market.
版本注释
- Added options to customize table position (top_left, top_right, bottom_left, bottom_right).
- Added options to adjust table font size (tiny, small, normal, large, huge).
- Minor improvements and optimizations to table display.
开源脚本
秉承TradingView的精神,该脚本的作者将其开源,以便交易者可以查看和验证其功能。向作者致敬!您可以免费使用该脚本,但请记住,重新发布代码须遵守我们的网站规则。
免责声明
这些信息和出版物并非旨在提供,也不构成TradingView提供或认可的任何形式的财务、投资、交易或其他类型的建议或推荐。请阅读使用条款了解更多信息。
免责声明
这些信息和出版物并非旨在提供,也不构成TradingView提供或认可的任何形式的财务、投资、交易或其他类型的建议或推荐。请阅读使用条款了解更多信息。