INVITE-ONLY SCRIPT
已更新 Global Liquidity Index Correlation [MarktQuant]
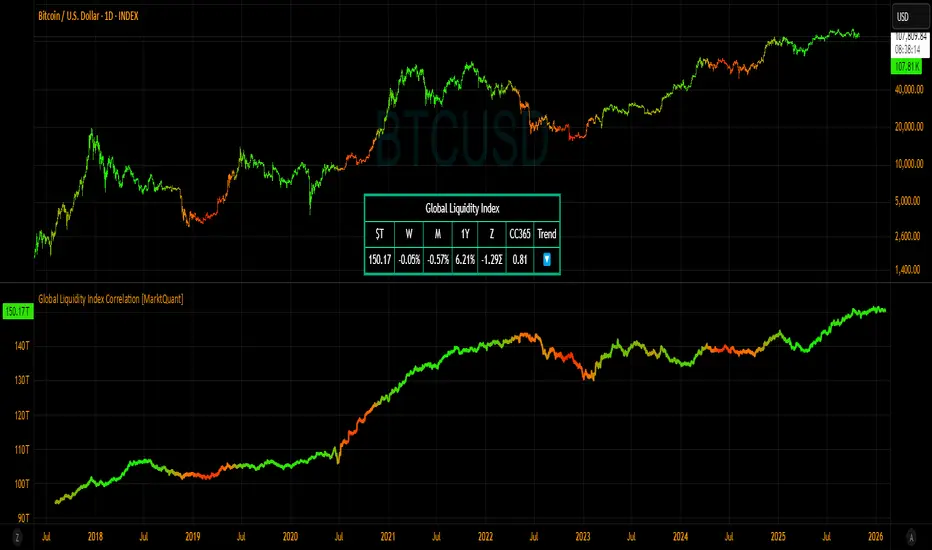
The Global Liquidity Index Correlation indicator is a TradingView tool that tracks global liquidity trends from major central banks and economic regions, displayed as a non-overlay indicator on a volume scale with two-decimal precision. It’s designed to help traders analyze how liquidity impacts markets.
Core Functionality
It aggregates liquidity data from sources like the U.S. Federal Reserve, ECB, PBC, BOJ, and others, converting everything to USD. Users can view either the total liquidity (GL Index) or its Rate of Change (GLI RoC), with options to smooth the data and adjust time periods for momentum and correlation analysis.
Visual Features
A table at the bottom center summarizes key stats: total liquidity (in trillions), weekly/monthly/yearly RoC, a correlation score with the asset’s price, and a trend arrow. The plotted line uses a color gradient (red to green) to show correlation direction and strength.
Use Case
Ideal for traders looking to connect global liquidity shifts with market movements, it’s flexible for both short- and long-term analysis.
Customization
Adjust smoothing, RoC period, lag for correlation, display mode, and which data sources to include.
This tool offers a clear, customizable way to monitor liquidity’s market influence.
版本注释
Color option for the RoC plot added. 版本注释
Updated the composition. Underlying component returns NaN(Data Error).
I will reupdated it once the data is available.
版本注释
- Added individual boolean input options to enable or disable each data source within the Global Liquidity Index.
- Introduced a Chinese Proxy Liquidity Index to capture regional liquidity dynamics.
- Added a Net Fed Liquidity Reserve Index for enhanced tracking of U.S. monetary conditions.
版本注释
.仅限邀请脚本
只有作者授权的用户才能访问此脚本。您需要申请并获得使用许可。通常情况下,付款后即可获得许可。更多详情,请按照下方作者的说明操作,或直接联系MarktQuant。
请注意,此私密、仅限邀请脚本未经脚本版主审核,是否符合网站规则尚未确定。 TradingView不建议您付费购买或使用任何脚本,除非您完全信任其作者并了解其工作原理。您也可以在我们的社区脚本找到免费的开源替代方案。
作者的说明
Included in Premium MarktQuant memberships—enjoy analyzing trends and spotting key levels! https://marktquant.com/products/membership
🔍 Access Investing Strategies & Indicators
📊 whop.com/marktquant
🌐 marktquant.com
Nothing shared on this page constitutes financial advice. All information, tools, and analyses are provided solely for informational and educational purposes.
📊 whop.com/marktquant
🌐 marktquant.com
Nothing shared on this page constitutes financial advice. All information, tools, and analyses are provided solely for informational and educational purposes.
免责声明
这些信息和出版物并非旨在提供,也不构成TradingView提供或认可的任何形式的财务、投资、交易或其他类型的建议或推荐。请阅读使用条款了解更多信息。
仅限邀请脚本
只有作者授权的用户才能访问此脚本。您需要申请并获得使用许可。通常情况下,付款后即可获得许可。更多详情,请按照下方作者的说明操作,或直接联系MarktQuant。
请注意,此私密、仅限邀请脚本未经脚本版主审核,是否符合网站规则尚未确定。 TradingView不建议您付费购买或使用任何脚本,除非您完全信任其作者并了解其工作原理。您也可以在我们的社区脚本找到免费的开源替代方案。
作者的说明
Included in Premium MarktQuant memberships—enjoy analyzing trends and spotting key levels! https://marktquant.com/products/membership
🔍 Access Investing Strategies & Indicators
📊 whop.com/marktquant
🌐 marktquant.com
Nothing shared on this page constitutes financial advice. All information, tools, and analyses are provided solely for informational and educational purposes.
📊 whop.com/marktquant
🌐 marktquant.com
Nothing shared on this page constitutes financial advice. All information, tools, and analyses are provided solely for informational and educational purposes.
免责声明
这些信息和出版物并非旨在提供,也不构成TradingView提供或认可的任何形式的财务、投资、交易或其他类型的建议或推荐。请阅读使用条款了解更多信息。