OPEN-SOURCE SCRIPT
FCNC Spread
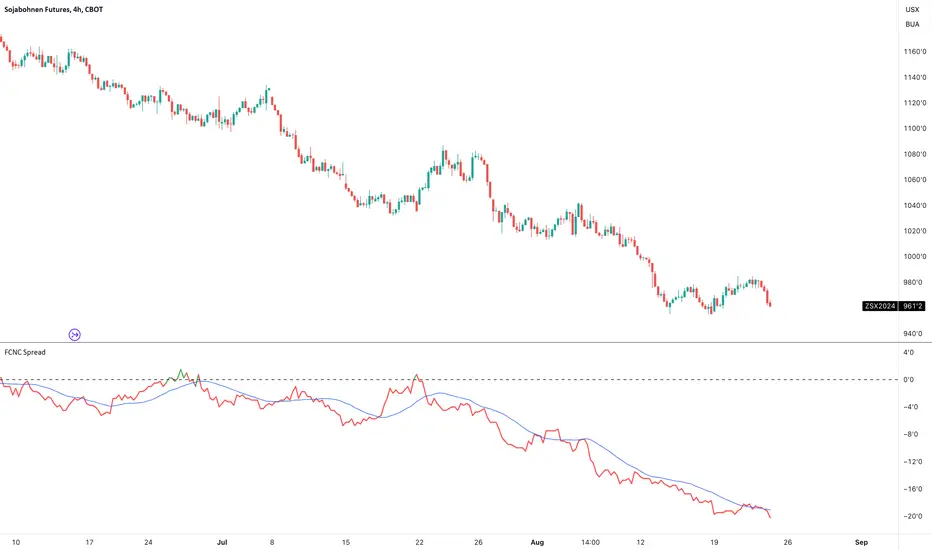
Title: FCNC Spread Indicator
Description:
The FCNC Spread Indicator is designed to help traders analyze the price difference (spread) between two futures contracts: the front contract and the next contract. This type of analysis is commonly used in futures trading to identify market sentiment, arbitrage opportunities, and potential roll yield strategies.
How It Works:
Front Contract: The front contract represents the futures contract closest to expiration, often referred to as the near-month contract.
Next Contract: The next contract is the futures contract that follows the front contract in the expiration cycle, typically the next available month.
Spread Calculation: frontContract - nextContract represents the difference between the price of the front contract and the next contract.
Positive Spread: A positive value means that the front contract is more expensive than the next contract, indicating backwardation.
Negative Spread: A negative value means that the front contract is cheaper than the next contract, indicating contango.
How to Use:
Input Selection: Select your desired futures contracts for the front and next contract through the input settings. The script will fetch and calculate the closing prices of these contracts.
Spread Plotting: The calculated spread is plotted on the chart, with color-coding based on the spread's value (green for positive, red for negative).
Labeling: The spread value is dynamically labeled on the chart for quick reference.
Moving Average: A 20-period Simple Moving Average (SMA) of the spread is also plotted to help identify trends and smooth out fluctuations.
Applications:
Trend Identification: Analyze the spread to determine market sentiment and potential trend reversals.
Divergence Detection: Look for divergences between the spread and the underlying market to identify possible shifts in trend or market sentiment. Divergences can signal upcoming reversals or provide early warning signs of a change in market dynamics.
This indicator is particularly useful for futures traders who are looking to gain insights into the market structure and to exploit differences in contract pricing. By providing a clear visualization of the spread between two key futures contracts, traders can make more informed decisions about their trading strategies.
开源脚本
秉承TradingView的精神,该脚本的作者将其开源,以便交易者可以查看和验证其功能。向作者致敬!您可以免费使用该脚本,但请记住,重新发布代码须遵守我们的网站规则。
免责声明
这些信息和出版物并非旨在提供,也不构成TradingView提供或认可的任何形式的财务、投资、交易或其他类型的建议或推荐。请阅读使用条款了解更多信息。
开源脚本
秉承TradingView的精神,该脚本的作者将其开源,以便交易者可以查看和验证其功能。向作者致敬!您可以免费使用该脚本,但请记住,重新发布代码须遵守我们的网站规则。
免责声明
这些信息和出版物并非旨在提供,也不构成TradingView提供或认可的任何形式的财务、投资、交易或其他类型的建议或推荐。请阅读使用条款了解更多信息。