INVITE-ONLY SCRIPT
Rfactory: Ken Long MACD Seasons
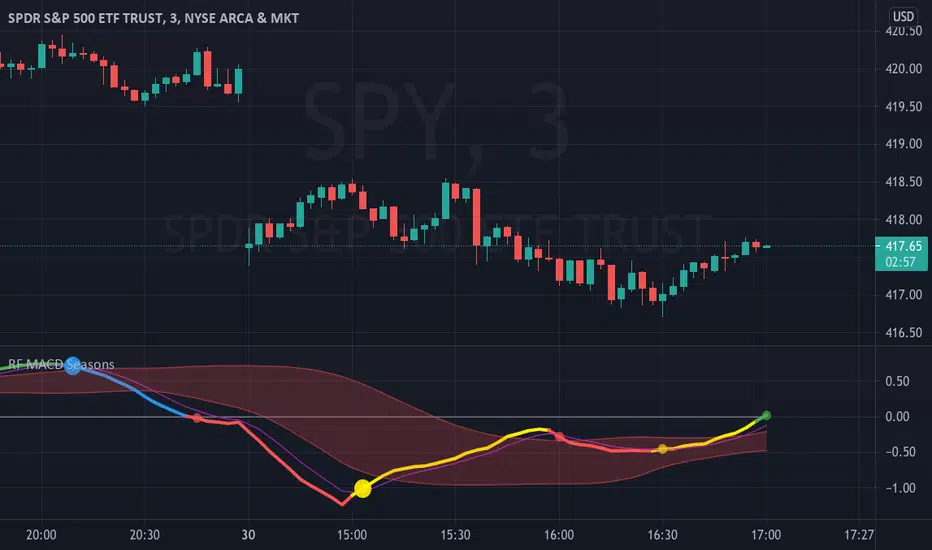
Rfactory has partnered with Dr Ken Long of Tortoise Capital Management to provide his MACD Seasons Indicator which is loaded into its own sub-graph. All settings are preconfigured to be the same as Dr Long uses out of the box and the plots include the MACD line colored by Season, the Signal line and the Red River. SSC (Spring Supported Crossing) Signals are specifically highlighted with large Dots on the MACD Line. Everything is customizable including not only coloring and line styles but also the underlying settings for lookbacks as well as a selector to use SMA's or EMA's for the calculations.
The MACD Seasons indicator helps identify where a market is in a seasonal cycle. In summer (green) the market is trending up and at an expanding pace. Once the season changes to Fall (blue) the market is still trending up but the pace has slowed. When the market moves into Winter (red) the trend has changed to down and at a quickening pace. In Spring (yellow) the trend is still down but the pace has slowed and we are looking ahead to get back to Summer.
The Red River volatility band is an indication of normal and helps identify in particular when a market is in a particularly harsh winter or summer.
The MACD Seasons works best with (and is an extension of) Dr Long's RLCO Framework.
仅限邀请脚本
仅限作者授权的用户访问此脚本,并且通常需要付费。您可以将其添加到收藏中,但是只有在向作者请求并获得许可之后,才能使用它。 请联系JeffBoccaccio了解更多信息,或按照以下作者的说明操作。
TradingView不建议付费使用脚本,除非您100%信任作者并了解脚本的工作原理。在许多情况下,您可以在我们的社区脚本免费找到不错的开源替代方案。
作者的说明
″For access to this indicator please contact Rfactory via PM, http://www.rfactory.io or email info@rfactory.io
想在图表上使用此脚本?
警告:请在申请访问权限之前阅读。
免责声明
这些信息和出版物并不意味着也不构成TradingView提供或认可的金融、投资、交易或其它类型的建议或背书。请在使用条款阅读更多信息。