OPEN-SOURCE SCRIPT
已更新 TICK Charting & Divergences
Overview
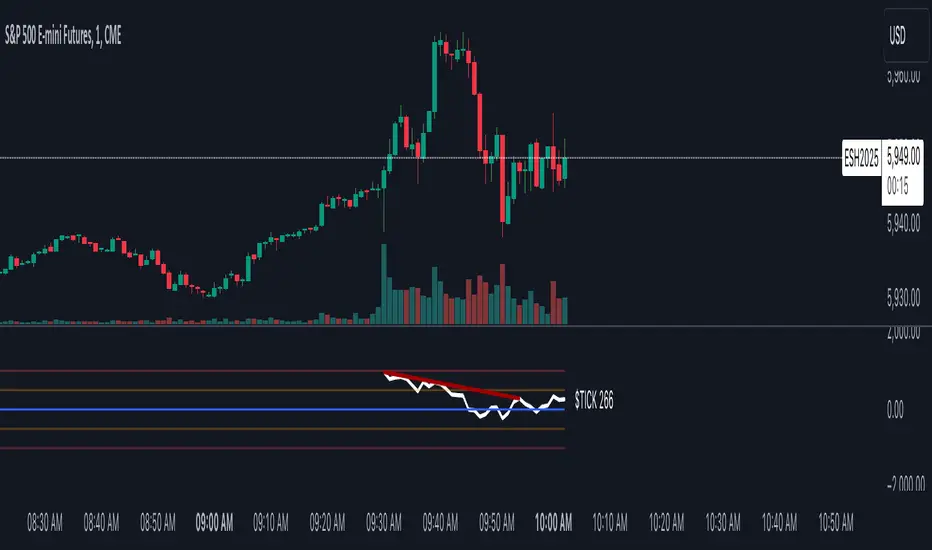
The TICK index measures the number of NYSE stocks making an uptick versus a downtick. This indicator identifies divergences between price action and TICK readings, potentially signaling trend reversals.
Key Features
TICK Internals Interpretation
Best Practices
Settings Optimization
Warning Signs
Remember: TICK divergences are not guaranteed signals. Always use proper risk management and combine with other technical analysis tools.
The TICK index measures the number of NYSE stocks making an uptick versus a downtick. This indicator identifies divergences between price action and TICK readings, potentially signaling trend reversals.
Key Features
- Real-time TICK monitoring during market hours (9:30 AM - 4:00 PM ET)
- Customizable smoothing factor for TICK values
- Regular and hidden divergences detection
- Reference lines at ±500 and ±1000 levels
- Current TICK value display
TICK Internals Interpretation
- Above +1000: Strong buying pressure, potential exhaustion
- Above +500: Moderate buying pressure
- Below -500: Moderate selling pressure
- Below -1000: Strong selling pressure, potential exhaustion
Best Practices
- Use in conjunction with support/resistance levels, market trend direction, and time of day.
- Higher probability setups with multiple timeframe confirmation, divergence at key price levels, and extreme TICK readings (±1000).
Settings Optimization
- Smoothing Factor: 1-3 (lower for faster signals)
- Pivot Lookback: 5-10 bars (adjust based on timeframe)
- Range: 5-60 bars (wider for longer-term signals)
Warning Signs
- Multiple failed divergences
- Choppy price action
- Low volume periods
- Major news events pending
Remember: TICK divergences are not guaranteed signals. Always use proper risk management and combine with other technical analysis tools.
版本注释
Updated with better chart image.版本注释
Updated naming in indicator pane.开源脚本
秉承TradingView的精神,该脚本的作者将其开源,以便交易者可以查看和验证其功能。向作者致敬!您可以免费使用该脚本,但请记住,重新发布代码须遵守我们的网站规则。
免责声明
这些信息和出版物并非旨在提供,也不构成TradingView提供或认可的任何形式的财务、投资、交易或其他类型的建议或推荐。请阅读使用条款了解更多信息。
开源脚本
秉承TradingView的精神,该脚本的作者将其开源,以便交易者可以查看和验证其功能。向作者致敬!您可以免费使用该脚本,但请记住,重新发布代码须遵守我们的网站规则。
免责声明
这些信息和出版物并非旨在提供,也不构成TradingView提供或认可的任何形式的财务、投资、交易或其他类型的建议或推荐。请阅读使用条款了解更多信息。