OPEN-SOURCE SCRIPT
Multi-Minute Interval Marker
Testing
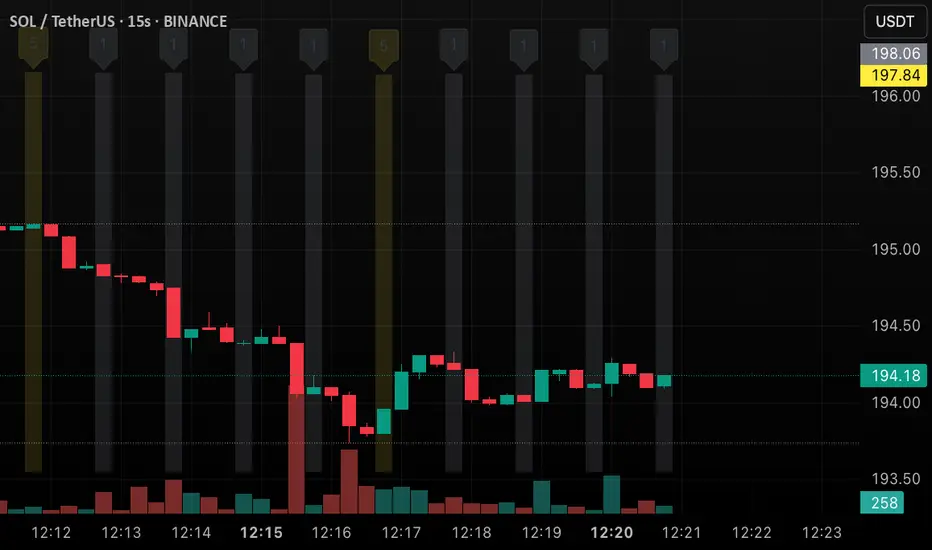
Apply this to a 15-second chart (e.g., SOL/USDT).
Verify that thin vertical lines with "1" (grey) and "5" (yellow) appear above the candles at 4-candle (1-minute) and 20-candle (5-minute) intervals, respectively.
The numbers should be positioned above the lines, and you can toggle the markers with show1Min and show5Min.
开源脚本
本着TradingView的真正精神,此脚本的创建者将其开源,以便交易者可以查看和验证其功能。向作者致敬!虽然您可以免费使用它,但请记住,重新发布代码必须遵守我们的网站规则。
免责声明
这些信息和出版物并不意味着也不构成TradingView提供或认可的金融、投资、交易或其它类型的建议或背书。请在使用条款阅读更多信息。
开源脚本
本着TradingView的真正精神,此脚本的创建者将其开源,以便交易者可以查看和验证其功能。向作者致敬!虽然您可以免费使用它,但请记住,重新发布代码必须遵守我们的网站规则。
免责声明
这些信息和出版物并不意味着也不构成TradingView提供或认可的金融、投资、交易或其它类型的建议或背书。请在使用条款阅读更多信息。