PROTECTED SOURCE SCRIPT
3 Heiken Ashi
# Heiken Ashi Overlay Indicator
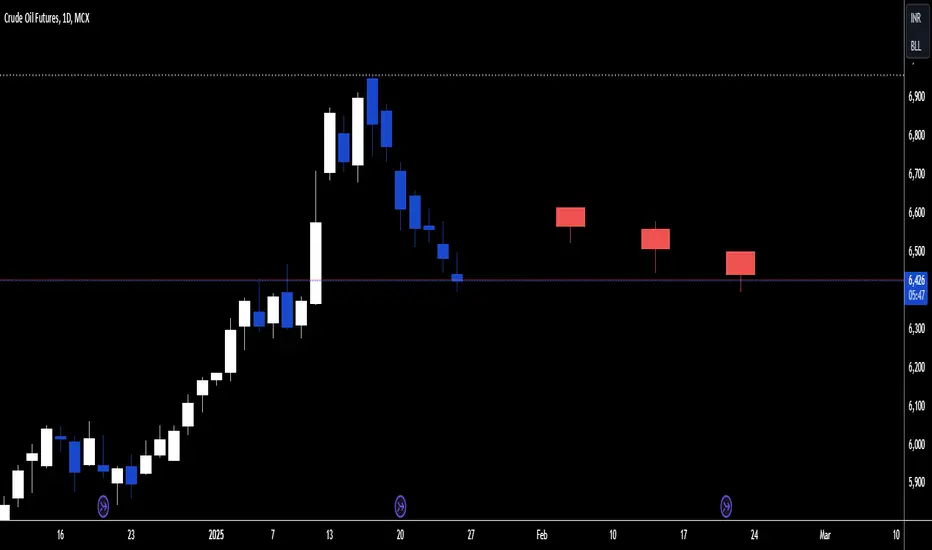
This custom indicator overlays the last three Heiken Ashi candles on your regular candlestick chart, providing traders with immediate trend direction insights without switching between chart types.
## Key Features
- **Real-time Overlay**: Displays three most recent Heiken Ashi candles on the right side of your chart
- **Color Coding**: Green candles indicate upward momentum, red candles show downward momentum
- **Timeframe Adaptive**: Maintains consistent display across all timeframes
- **Clean Visualization**: Clear separation between regular candlesticks and Heiken Ashi overlay
## Trading Applications
**Trend Confirmation**
- Green Heiken Ashi candles suggest strengthening bullish momentum
- Red Heiken Ashi candles indicate developing bearish pressure
- The sequence of colors helps identify potential trend reversals
**Decision Making Benefits**
- Quick trend assessment without chart switching
- Enhanced signal confirmation
- Reduced noise in trend identification
- Improved entry and exit timing
## Technical Details
The indicator uses standard Heiken Ashi calculations:
- HA Close = (Open + High + Low + Close)/4
- HA Open = Previous HA (Open + Close)/2
- HA High = Maximum(High, HA Open, HA Close)
- HA Low = Minimum(Low, HA Open, HA Close)
## Usage Tips
1. Use alongside your regular technical analysis
2. Watch for color changes as early trend reversal signals
3. Consider the size of Heiken Ashi candles for momentum strength
4. Compare with price action on the main chart for confirmation
This overlay combines the smoothing benefits of Heiken Ashi with the precision of regular candlesticks, offering traders a powerful tool for trend analysis and decision-making.
受保护脚本
此脚本以闭源形式发布。 但是,您可以自由使用,没有任何限制 — 了解更多信息这里。
免责声明
这些信息和出版物并非旨在提供,也不构成TradingView提供或认可的任何形式的财务、投资、交易或其他类型的建议或推荐。请阅读使用条款了解更多信息。
受保护脚本
此脚本以闭源形式发布。 但是,您可以自由使用,没有任何限制 — 了解更多信息这里。
免责声明
这些信息和出版物并非旨在提供,也不构成TradingView提供或认可的任何形式的财务、投资、交易或其他类型的建议或推荐。请阅读使用条款了解更多信息。