OPEN-SOURCE SCRIPT
已更新 Previous Day & Week Highs and Lows
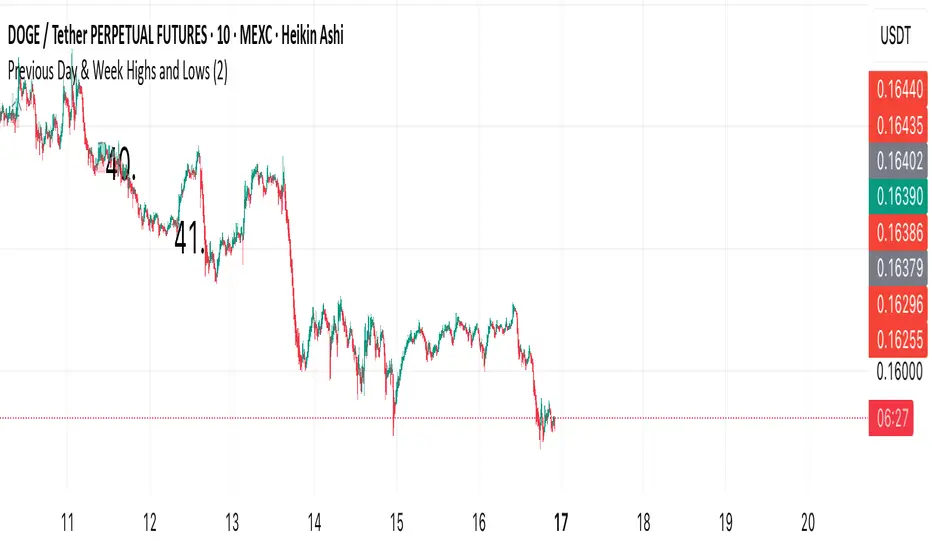
Overlay indicator that plots horizontal lines for the previous day’s and previous week’s highs and lows. Lines extend until the next period starts, so you can see these levels throughout the current day or week.
The indicator detects new daily and weekly sessions and draws lines at the previous period’s high and low. Daily levels use green (high) and red (low); weekly levels use blue (high) and magenta (low). You can toggle daily/weekly independently, customize colors, and adjust line width. It works on intraday timeframes and helps identify support/resistance and track breakouts relative to prior periods.
The indicator detects new daily and weekly sessions and draws lines at the previous period’s high and low. Daily levels use green (high) and red (low); weekly levels use blue (high) and magenta (low). You can toggle daily/weekly independently, customize colors, and adjust line width. It works on intraday timeframes and helps identify support/resistance and track breakouts relative to prior periods.
版本注释
Overlay indicator that plots horizontal lines for the previous day’s and previous week’s highs and lows. Lines extend until the next period starts, so you can see these levels throughout the current day or week.The indicator detects new daily and weekly sessions and draws lines at the previous period’s high and low. Daily levels use green (high) and red (low); weekly levels use blue (high) and magenta (low). You can toggle daily/weekly independently, customize colors, and adjust line width. It works on intraday timeframes and helps identify support/resistance and track breakouts relative to prior periods.
开源脚本
秉承TradingView的精神,该脚本的作者将其开源,以便交易者可以查看和验证其功能。向作者致敬!您可以免费使用该脚本,但请记住,重新发布代码须遵守我们的网站规则。
免责声明
这些信息和出版物并非旨在提供,也不构成TradingView提供或认可的任何形式的财务、投资、交易或其他类型的建议或推荐。请阅读使用条款了解更多信息。
开源脚本
秉承TradingView的精神,该脚本的作者将其开源,以便交易者可以查看和验证其功能。向作者致敬!您可以免费使用该脚本,但请记住,重新发布代码须遵守我们的网站规则。
免责声明
这些信息和出版物并非旨在提供,也不构成TradingView提供或认可的任何形式的财务、投资、交易或其他类型的建议或推荐。请阅读使用条款了解更多信息。