PROTECTED SOURCE SCRIPT
Z-Score Indicator
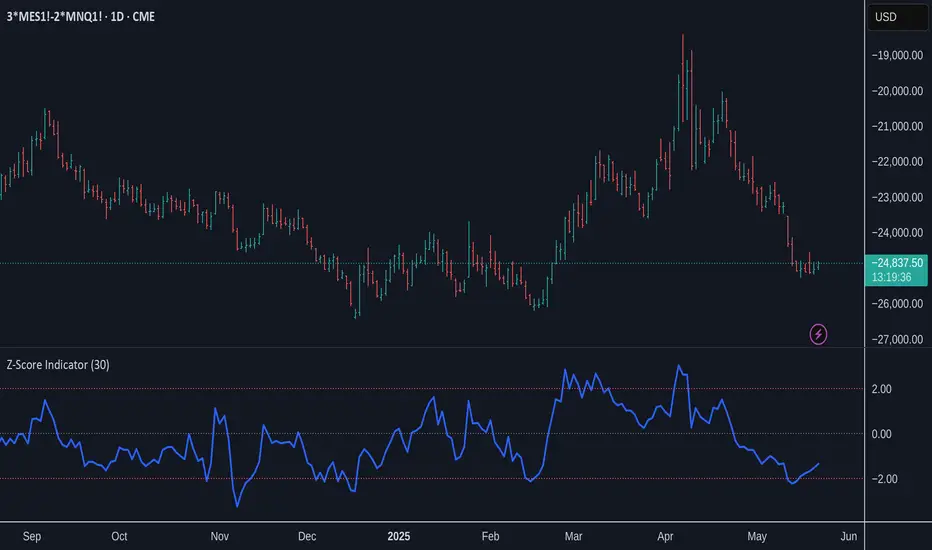
What it does:
Key Features:
Reference Lines:
How to use it:
- Calculates the Z-Score: (Current Price - Average Price) / Standard Deviation
- Plots the Z-Score in a separate panel below your main chart.
- Allows you to customize the Lookback Period (default is 30 bars) to suit your trading style and the asset's characteristics. A shorter period is more sensitive, while a longer period provides a smoother output.
Key Features:
- Clear Z-Score Line: Visualizes the current Z-Score value.
Reference Lines:
- Zero Line (Gray, Dotted): Indicates the price is at its average for the lookback period.
- +2 Standard Deviations (Red, Dotted): Highlights when the price is significantly above its recent average. Often interpreted as potentially overbought.
- -2 Standard Deviations (Red, Dotted): Highlights when the price is significantly below its recent average. Often interpreted as potentially oversold.
How to use it:
- Look for Z-Score values moving towards or beyond the +2 or -2 standard deviation lines. These extremes can signal that the price has moved unusually far from its mean and might be due for a reversion or a pause.
- Use it in conjunction with other indicators and your overall market analysis to make more informed trading decisions.
- Experiment with the "Lookback Period" setting to find what works best for different assets and timeframes.
受保护脚本
此脚本以闭源形式发布。 但是,您可以自由使用,没有任何限制 — 了解更多信息这里。
免责声明
这些信息和出版物并非旨在提供,也不构成TradingView提供或认可的任何形式的财务、投资、交易或其他类型的建议或推荐。请阅读使用条款了解更多信息。
受保护脚本
此脚本以闭源形式发布。 但是,您可以自由使用,没有任何限制 — 了解更多信息这里。
免责声明
这些信息和出版物并非旨在提供,也不构成TradingView提供或认可的任何形式的财务、投资、交易或其他类型的建议或推荐。请阅读使用条款了解更多信息。