INVITE-ONLY SCRIPT
已更新 Adulari Oscillator
This indicator is included with Adulari Professional.
Adulari Oscillator is a trading tool that can be used on any asset, and any given timeframe. It is special because it self-optimizes, meaning no configuration is required before usage.
How do I use it?
The accuracy shown in the indicator is merely a tool. Past results do not indicate future results. Historical data will differ from future data.
Features:
How does it work?
The oscillator line is calculated using our custom version of the very well-known and loved stochastic. The bullish signals are given when the oscillator value falls below the oversold line, and the bearish signals when the oscillator value exceeds the overbought line. These oversold and overbought lines are determined by our algorithm. The accuracy shown in the dashboard is calculated with the following methods: the highest or lowest price within the lookback range divided by the price at the moment of a signal multiplied by the minimum percentage change. When this condition is true it means a signal was valid and thus it will be added to the total wins, when the condition is false it will be added to the total losses. Accuracy is then determined by dividing the total wins by total signals. A win is when the minimum percentage move in the settings occurred within x amount of bars (settings) after a signal. When these conditions are not met, it will be considered a loss. Keep in mind that this is not a trading strategy, and these wins/losses do not represent actual trades. The accuracy also does not represent a winrate or anything of a sort while using the indicator.
This script is unique because it does a few things. It self-optimizes based on historical data, which I was not able to find in this specific stochastic like oscillator format. And it will show you the average accuracy of the signals based on all the signals given on the chart, which I was not able to find in this same exact format either.
Adulari Oscillator is a trading tool that can be used on any asset, and any given timeframe. It is special because it self-optimizes, meaning no configuration is required before usage.
How do I use it?
- Never use this indicator as standalone trading signal, it is meant to be used as confirmation.
- Look for strong trends crossing on the middle line.
- Combine the trend strength indications with the signals. For example: if a bullish signal was printed after a strong downtrend this may indicate a strong reversal.
The accuracy shown in the indicator is merely a tool. Past results do not indicate future results. Historical data will differ from future data.
Features:
- Self-optimizing, no configuration required.
- Purple dots for bullish trend reversals, gray crosses for bearish trend reversals.
- Gradient histogram that shows the strength of a bullish or bearish trend with a stronger color.
- White line that indicates clear bottoms or tops.
- Automatically determined top and bottom borders that may show trend reversals.
- Dashboard that shows the accuracy of the signals, total amount of signals, total amount won, and total amount lost.
- Alert conditions that allow you to set alerts for bullish or bearish signals.
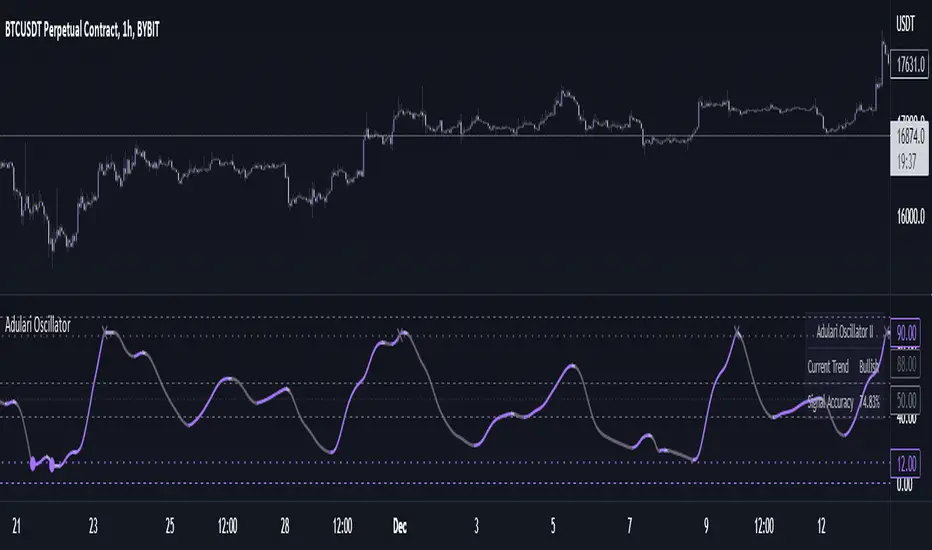
How does it work?
The oscillator line is calculated using our custom version of the very well-known and loved stochastic. The bullish signals are given when the oscillator value falls below the oversold line, and the bearish signals when the oscillator value exceeds the overbought line. These oversold and overbought lines are determined by our algorithm. The accuracy shown in the dashboard is calculated with the following methods: the highest or lowest price within the lookback range divided by the price at the moment of a signal multiplied by the minimum percentage change. When this condition is true it means a signal was valid and thus it will be added to the total wins, when the condition is false it will be added to the total losses. Accuracy is then determined by dividing the total wins by total signals. A win is when the minimum percentage move in the settings occurred within x amount of bars (settings) after a signal. When these conditions are not met, it will be considered a loss. Keep in mind that this is not a trading strategy, and these wins/losses do not represent actual trades. The accuracy also does not represent a winrate or anything of a sort while using the indicator.
This script is unique because it does a few things. It self-optimizes based on historical data, which I was not able to find in this specific stochastic like oscillator format. And it will show you the average accuracy of the signals based on all the signals given on the chart, which I was not able to find in this same exact format either.
版本注释
- Added the option to enable or disable repainting. Disabled by default.
版本注释
- All versions of our oscillators have now been combined into one indicator. You may switch to your preferred version by using the dedicated setting.
- Dashboard is now using tables instead of labels.
- Trend accuracy has been added.
- Signal accuracy has been updated to show more reliable data.
- 8 new smoothing types have been added, of which 2 are completely custom.
- Dashboard position is adjustable.
- Bar lookback for rescaling is now adjustable.
- Trend multiply calculations have been updated.
- More customization has been added, inputs have been redesigned.
仅限邀请脚本
只有作者授权的用户才能访问此脚本。您需要申请并获得使用许可。通常情况下,付款后即可获得许可。更多详情,请按照下方作者的说明操作,或直接联系Adulari。
TradingView不建议您付费购买或使用任何脚本,除非您完全信任其作者并了解其工作原理。您也可以在我们的社区脚本找到免费的开源替代方案。
作者的说明
This will become a paid indicator in the future. You may request access for now by contacting us, this indicator can currently be tested for free: https://adulari.dev/contact
免责声明
这些信息和出版物并非旨在提供,也不构成TradingView提供或认可的任何形式的财务、投资、交易或其他类型的建议或推荐。请阅读使用条款了解更多信息。