OPEN-SOURCE SCRIPT
已更新 Physical Levels (XAUUSD, 5$ Pricesteps)
Functionality:
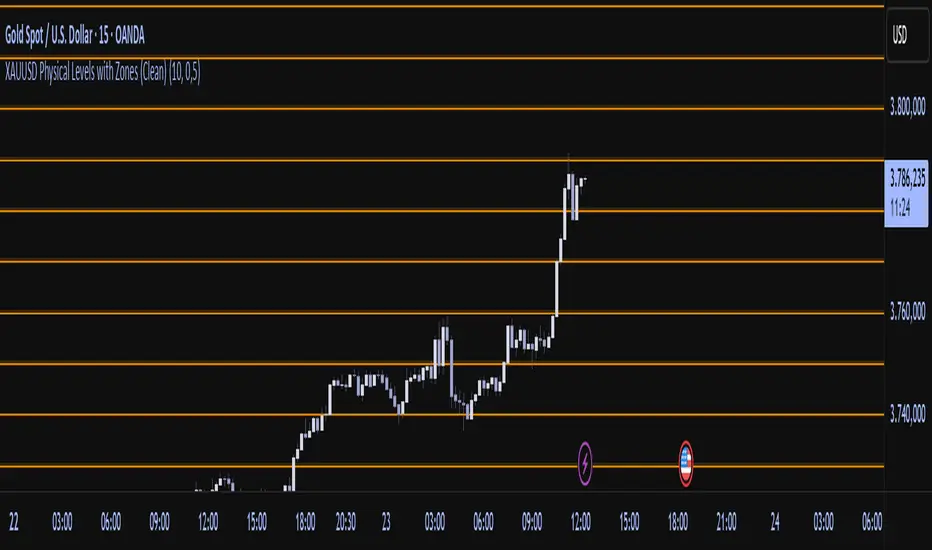
This indicator draws horizontal lines in the XAUUSD market at a fixed spacing of USD 5. The lines are both above and below the current market price. The number of lines is limited to optimize performance.
Use:
The indicator is particularly useful for traders who want to analyze psychological price levels, support and resistance areas, or significant price zones in the gold market. It helps to better visualize price movements and their proximity to round numbers.
How it works:
- The indicator calculates a starting price based on the current price of XAUUSD, rounded to the nearest multiple of USD 5.
- Starting from this starting price, evenly distributed lines are drawn up and down.
- The lines are black throughout and are updated dynamically according to the current chart.
版本注释
🆕 Update: Enhanced Physical Levels in XAUUSD IndicatorThis update introduces several improvements for greater flexibility and visual clarity when using the indicator:
✅ What's New:
Multiple Price Level Intervals:
You can now display horizontal lines at intervals of $5, $10, and $25—individually or all at once.
Customizable Line Colors:
Each interval category has its own customizable color setting, using TradingView’s built-in color palette. This allows for better visual distinction between levels.
User-Friendly Controls:
All new features are configurable via the indicator’s settings panel, including:
Enabling/disabling specific intervals
Choosing individual colors
Setting the maximum number of lines per category (default: 20)
🔧 Other Improvements:
Improved logic for determining the base price level closest to the current market price.
Optimized performance by limiting the number of lines drawn.
版本注释
Updated Picture to showcase版本注释
Fully translated in English版本注释
🔧 Update: Improved Level Alignment LogicWe've fine-tuned the logic for how horizontal levels are positioned on the Physical Levels in XAUUSD indicator to ensure greater price precision and consistency.
🆕 What's Changed:
$5 Levels now align to prices like 3275, 3280, 3285, ...
→ Nearest multiples of 5, starting from the closest to the current price.
$10 Levels now align to prices like 3270, 3280, 3290, ...
→ Clean multiples of 10 on whole numbers.
$25 Levels now align to prices like 3200, 3225, 3250, ...
→ Starting from the closest multiple of 25 for better macro-level structure.
This change improves the visual clarity and practical alignment with round-number psychological levels often used by traders.
版本注释
📌 Patch Notes – XAUUSD Physical Levels with Zones✨ New Features
1. Price-Proximity Display
Lines and zones are now shown only within a limited range:
Default: 10 lines/zones above and 10 lines/zones below the current market price.
Adjustable via Visible Lines per Side.
2. Line Directly at Current Price
New option: Show Line directly at current price.
Adds a line exactly at the nearest rounded price level (including a zone if enabled).
Can be toggled on/off.
3. Zones Around Price Levels
Each price line can now be highlighted with a transparent zone.
Options include:
- Show Zones around Lines → On/Off
- Zone Half-Width in USD → Zone width in USD (e.g., 0.5 → ±0.5 around the line)
- Customizable colors & transparency for each category ($5, $10, $25).
⚡ Improvements1. Clean Object Handling
Old lines and boxes are automatically deleted on each bar update.
Prevents chart clutter from thousands of outdated objects.
All new features (price line, zones, width, colors) can be fully configured via the indicator settings panel.
版本注释
=== NEW Version - Update Notes ===• New setting: "Bars Shown into the Past"
- You can now set how far back the lines and zones are drawn.
- Default value: 3000 bars
- Maximum value: 10000 bars
• Updated default indicator settings:
- $5 price levels are now automatically displayed when adding the indicator to the chart.
- Number of lines/zones above and below the price is now set to 15 by default.
• All previous features and visualizations remain unchanged.
开源脚本
秉承TradingView的精神,该脚本的作者将其开源,以便交易者可以查看和验证其功能。向作者致敬!您可以免费使用该脚本,但请记住,重新发布代码须遵守我们的网站规则。
免责声明
这些信息和出版物并非旨在提供,也不构成TradingView提供或认可的任何形式的财务、投资、交易或其他类型的建议或推荐。请阅读使用条款了解更多信息。
免责声明
这些信息和出版物并非旨在提供,也不构成TradingView提供或认可的任何形式的财务、投资、交易或其他类型的建议或推荐。请阅读使用条款了解更多信息。