OPEN-SOURCE SCRIPT
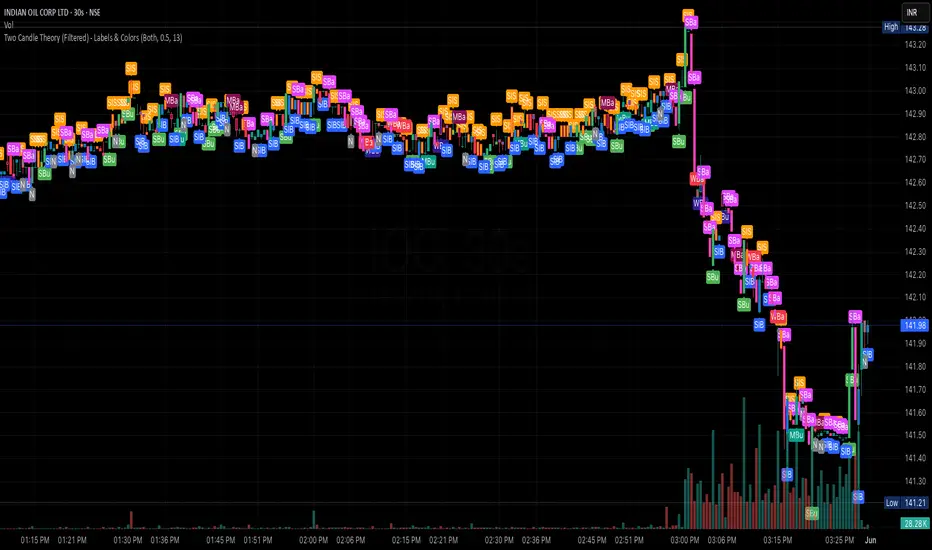
Two Candle Theory (Filtered) - Labels & Colors
Overview
This Pine Script classifies each candle into one of nine sentiment categories based on how the candle closes within its own range and in relation to the previous candle’s high and low. It optionally filters the strongest bullish and bearish signals based on volume spikes.
The script is designed to help traders visually interpret market sentiment through configurable labels and candle colors.
⸻
Classification Logic
Each candle is assessed using two metrics:
1. Close Position – where the candle closes within its own high-low range (High, Mid, Low).
2. Close Comparison – how the current close compares to the previous candle’s high and low (Bull, Bear, or Range).
Based on this, a short label is assigned:
• Bullish Bias: Strongest (SBu), Moderate (MBu), Weak (WBu), Slight (SlB)
• Neutral: Neutral (N)
• Bearish Bias: Slight (SlS), Weak (WBa), Moderate (MBa), Strongest (SBa)
⸻
Volume Filter
A volume spike filter can be applied to the strongest signals:
• SBu and SBa are only shown if volume is significantly higher than the average (SMA × threshold).
• The filter is optional and user-configurable.
⸻
Display Options
Users can control:
• Whether to show labels, bar colors, or both.
• Which of the nine label types are visible.
• Custom colors for each label and corresponding bar.
⸻
Visual Output
• Labels appear above or below candles depending on bullish or bearish classification.
• Bar colors reflect sentiment for quicker visual scanning.
⸻
Use Case
Ideal for identifying momentum shifts, validating trade entries, and highlighting candles that break out of previous ranges with conviction and/or volume.
⸻
Summary
This script simplifies price action by translating each candle into an interpretable sentiment label and color. With optional volume filtering and full display customization, it offers a practical tool for discretionary and systematic traders alike.
开源脚本
秉承TradingView的精神,该脚本的作者将其开源,以便交易者可以查看和验证其功能。向作者致敬!您可以免费使用该脚本,但请记住,重新发布代码须遵守我们的网站规则。
免责声明
这些信息和出版物并非旨在提供,也不构成TradingView提供或认可的任何形式的财务、投资、交易或其他类型的建议或推荐。请阅读使用条款了解更多信息。
免责声明
这些信息和出版物并非旨在提供,也不构成TradingView提供或认可的任何形式的财务、投资、交易或其他类型的建议或推荐。请阅读使用条款了解更多信息。