PROTECTED SOURCE SCRIPT
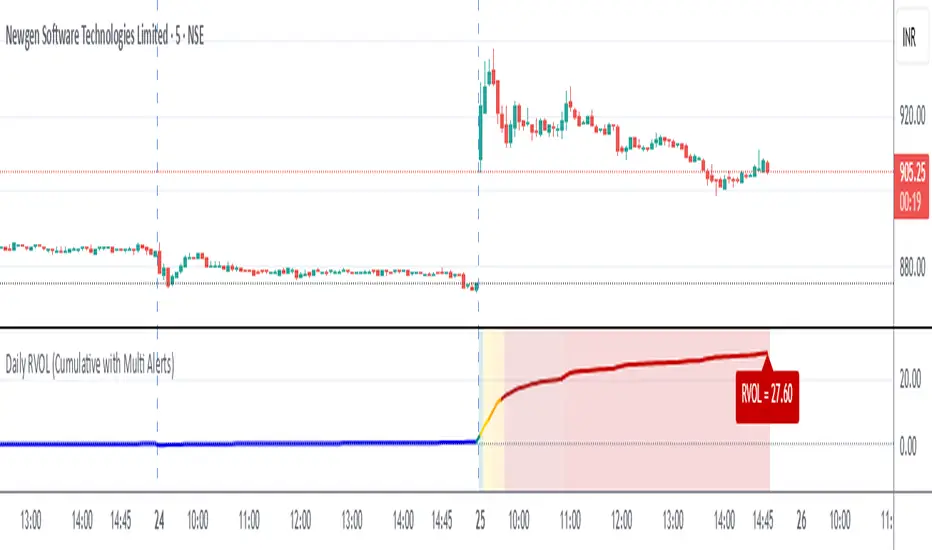
Daily RVOL (Cumulative with Multi Alerts)
Daily RVOL (Cumulative with Multi Alerts)
This indicator plots Relative Volume (RVOL) on intraday charts by comparing today’s cumulative traded volume with either:
The average daily volume of the past N days (default 5), or
Yesterday’s total daily volume (selectable from settings).
Unlike per-candle RVOL indicators, this version tracks cumulative intraday RVOL that only increases throughout the trading day. This matches how professional scanners (like Chartink/Gocharting) calculate RVOL, e.g. RVOL = 6 at open → 12 → 20 → 45 by end of day.
受保护脚本
此脚本以闭源形式发布。 但是,您可以自由使用,没有任何限制 — 了解更多信息这里。
免责声明
这些信息和出版物并非旨在提供,也不构成TradingView提供或认可的任何形式的财务、投资、交易或其他类型的建议或推荐。请阅读使用条款了解更多信息。
免责声明
这些信息和出版物并非旨在提供,也不构成TradingView提供或认可的任何形式的财务、投资、交易或其他类型的建议或推荐。请阅读使用条款了解更多信息。