OPEN-SOURCE SCRIPT
Bijnor Pivot Extended
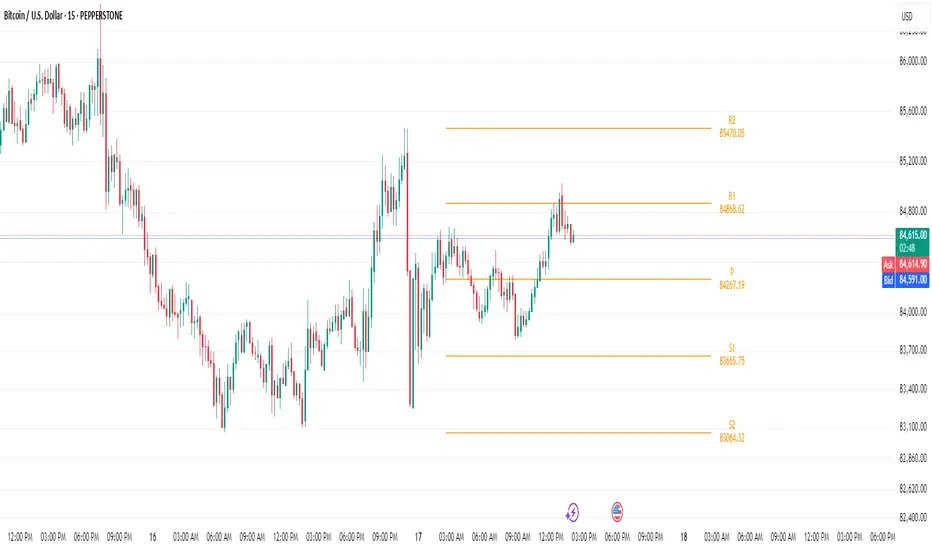
Overview: The Bijnor Pivot Extended (BP+) indicator is a powerful visual tool designed to help traders identify key price levels using Fibonacci-based pivots. It dynamically plots Support and Resistance levels based on your chosen timeframe (Daily, Weekly, or Monthly) and displays them only for the current session, reducing chart clutter and improving focus.
🔧 Features:
📆 Pivot Timeframe Selection: Choose between Daily, Weekly, or Monthly pivots.
🎯 Fibonacci Pivot Levels:
Central Pivot (P)
Resistance: R1, R2, R3, R4 (Extended)
Support: S1, S2, S3, S4 (Extended)
🎨 Full Customization:
Toggle labels and prices on/off
Position labels to the left or right
Change line width and individual colors for pivot, support, and resistance lines
🧠 Smart Line Plotting:
Lines are drawn only during the selected session, keeping your chart clean
🕹️ Max Performance: Optimized to stay lightweight with max_lines_count and max_labels_count set to 500
🧭 How to Use It:
Use this indicator to:
Plan entries and exits around key Fibonacci pivot zones
Identify overbought/oversold zones at R3/R4 and S3/S4
Enhance your intraday, swing, or positional trading setups
Combine with price action, candlestick patterns, or volume for maximum edge.
✅ Bonus:
This script is ideal for traders looking for a minimalist yet powerful pivot framework, with extended levels for breakout or reversal scenarios.
开源脚本
秉承TradingView的精神,该脚本的作者将其开源,以便交易者可以查看和验证其功能。向作者致敬!您可以免费使用该脚本,但请记住,重新发布代码须遵守我们的网站规则。
免责声明
这些信息和出版物并非旨在提供,也不构成TradingView提供或认可的任何形式的财务、投资、交易或其他类型的建议或推荐。请阅读使用条款了解更多信息。
开源脚本
秉承TradingView的精神,该脚本的作者将其开源,以便交易者可以查看和验证其功能。向作者致敬!您可以免费使用该脚本,但请记住,重新发布代码须遵守我们的网站规则。
免责声明
这些信息和出版物并非旨在提供,也不构成TradingView提供或认可的任何形式的财务、投资、交易或其他类型的建议或推荐。请阅读使用条款了解更多信息。