OPEN-SOURCE SCRIPT
已更新 Clownpumps Higher/Lower Close Analysis (HLCA) Indicator
The Clownpumps Higher/Lower Close Analysis" (HLCA) indicator offers a visual breakdown of the weekly behavior of a market, illustrating how often it closes higher or lower than its opening price. This comprehensive tool assists traders and analysts in pinpointing recurrent patterns that pertain to specific weekdays, forming a solid basis for a systematic trading strategy.
Features and Interpretation:
Color-Coded Analysis: The HLCA uses two intuitive colors to depict the daily trend:
Green: Indicates that, on average, the market closes higher than its opening price more frequently on that day.
Red: Highlights days when the market generally closes lower than its opening price.
Identifying Recurrent Patterns: Using the HLCA can reveal if a specific weekday consistently sees an asset closing higher or lower. For example, a consistent bullish sentiment on Mondays for a particular stock becomes easily observable.
Comparative Analysis: Deploying the HLCA across a range of assets can uncover trends that are either sector-wide or unique to individual stocks or cryptocurrencies.
Strategic Entry & Exit Points: Knowledge of which days an asset generally closes higher can guide traders in timing their market entries and exits.
Complementary to Other Tools: While the HLCA is a robust tool in itself, its true potential is unlocked when used in tandem with other market indicators. Pairing the daily closing patterns with volume data, for instance, can shed light on the strength of the observed trends.
Cautionary Notes:
Past behavior doesn't predict future performance. Always remember that correlation doesn't guarantee causation, especially when external market-shifting events come into play.
It's recommended to backtest any insights on historical data before committing to live trades.
版本注释
Certainly!Clownpums HLCA (Higher Lower Close Analyzer)
Description:
The "Clownpums HLCA" is a versatile trading tool tailored to identify and visualize patterns related to the market's closing behavior on specific weekdays. At its core, the HLCA tracks two primary metrics:
Streaks: How many consecutive days the market has closed higher or lower than its opening.
Weekly Analysis: How many times, on a particular weekday (from Monday to Friday), the market has closed higher or lower than its opening.
Visual Representation:
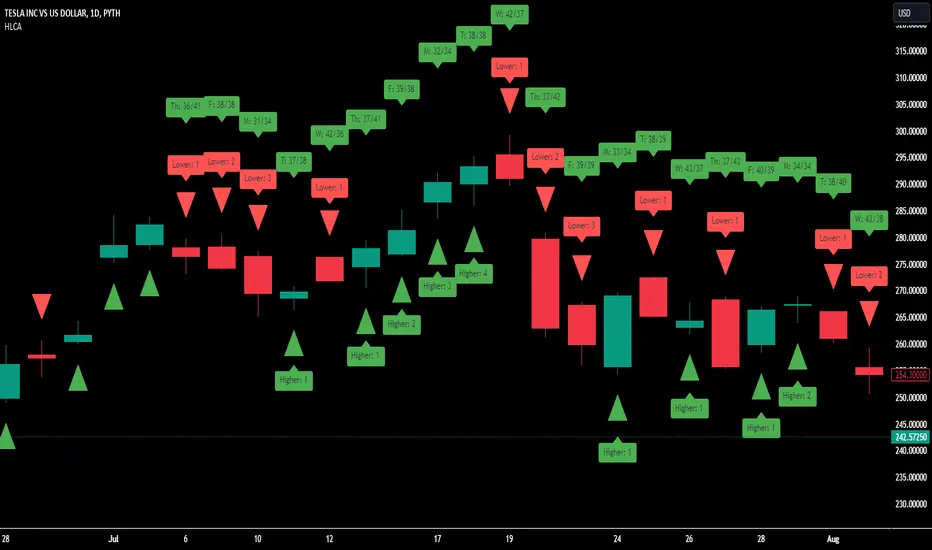
A green triangle below the candlestick indicates a day where the market closed higher than its opening.
A red triangle above the candlestick signifies a day where the market closed lower.
Labels attached to the candlesticks specify the number of consecutive days of higher or lower closes.
For the weekly analysis, labels show counts in the format "Higher Closes/Lower Closes" for each specific weekday.
How to Use the HLCA:
Streaks Analysis: By monitoring streaks of consecutive higher or lower closes, a trader can gauge the momentum and sentiment in the market. Extended streaks could signify strong bullish or bearish trends, while sudden breaks in streaks might indicate potential reversals.
Weekly Closing Patterns: The HLCA provides a unique perspective by breaking down the closing behavior on specific weekdays. This can be incredibly useful for identifying potential recurring patterns or biases on certain days. For instance, if you observe that a stock frequently closes higher on Wednesdays over an extended period, it may be indicative of a trading pattern or external factor affecting the asset on that particular weekday.
Combining Metrics: Using both the streak and weekly analysis together, traders can get a comprehensive view of the market's behavior. For instance, if you're in the midst of a bullish streak and it's a day where historically the market closes higher, this could provide added confidence in a trading decision.
Scanning and Research: Traders can utilize the HLCA across different stocks or cryptocurrencies to identify those with strong weekday biases. Over time, these patterns can offer unique trading opportunities that might be overlooked using traditional analysis methods.
Color Coding:
Green: Indicates bullish behavior where the close was higher than the open.
Red: Indicates bearish behavior where the close was lower than the open.
开源脚本
本着TradingView的真正精神,此脚本的创建者将其开源,以便交易者可以查看和验证其功能。向作者致敬!虽然您可以免费使用它,但请记住,重新发布代码必须遵守我们的网站规则。
免责声明
这些信息和出版物并不意味着也不构成TradingView提供或认可的金融、投资、交易或其它类型的建议或背书。请在使用条款阅读更多信息。
开源脚本
本着TradingView的真正精神,此脚本的创建者将其开源,以便交易者可以查看和验证其功能。向作者致敬!虽然您可以免费使用它,但请记住,重新发布代码必须遵守我们的网站规则。
免责声明
这些信息和出版物并不意味着也不构成TradingView提供或认可的金融、投资、交易或其它类型的建议或背书。请在使用条款阅读更多信息。