OPEN-SOURCE SCRIPT
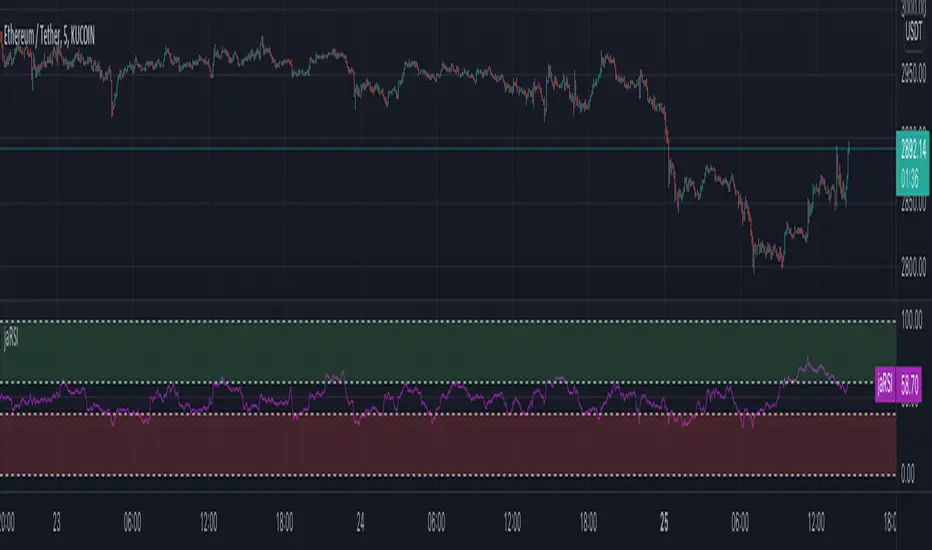
Just Another RSI
This is slightly different implementation of RSI using arrays. But, it also comes with a twist.
Formula for standard RSI can be found here: investopedia.com/terms/r/rsi.asp
https://www.tradingview.com/x/cWTAH192/
If there is green candle, gain for the candle is equal to price movement from previous bar and loss for that candle is 0. Similarly in case of red candle, loss is considered to be movement from previous candle whereas gain is 0. Also, as mentioned in step2, on each bar, average of previous bar gains/losses are merged with present candle gain/loss.
New Process
How it is different
Since, gain and loss are only considered if there are gain and loss, this index represents the strength between bullish and bearish candles without looking at price movement. Hence, the index has capability to go in opposite direction of the price representing price movement is not supported by strength.
Another advantage of this implementation is it allows using variable length for the method. In case of RSI, length has to be constant. It cannot be variable which can change every bar. But, we do not have that constraint in this implementation due to use of arrays.
At present, this is purely experimental. I will look forward to study this more with respect to divergence and for use in trend following methods.
Formula for standard RSI can be found here: investopedia.com/terms/r/rsi.asp
https://www.tradingview.com/x/cWTAH192/
If there is green candle, gain for the candle is equal to price movement from previous bar and loss for that candle is 0. Similarly in case of red candle, loss is considered to be movement from previous candle whereas gain is 0. Also, as mentioned in step2, on each bar, average of previous bar gains/losses are merged with present candle gain/loss.
New Process
- Gain is considered only on green candles. Hence, there is no zero gain candles
- Loss is considered only on red candles. Hence, there is no zero loss candles
- Average or median of last N gains and losses are considered. Hence, the movement mainly tell us the strength between bullish and bearish candles.
- Let us forget about seeing it as overbought and oversold area and look at it as bullish and bearish region.
How it is different
Since, gain and loss are only considered if there are gain and loss, this index represents the strength between bullish and bearish candles without looking at price movement. Hence, the index has capability to go in opposite direction of the price representing price movement is not supported by strength.
Another advantage of this implementation is it allows using variable length for the method. In case of RSI, length has to be constant. It cannot be variable which can change every bar. But, we do not have that constraint in this implementation due to use of arrays.
At present, this is purely experimental. I will look forward to study this more with respect to divergence and for use in trend following methods.
开源脚本
秉承TradingView的精神,该脚本的作者将其开源,以便交易者可以查看和验证其功能。向作者致敬!您可以免费使用该脚本,但请记住,重新发布代码须遵守我们的网站规则。
Trial - trendoscope.io/trial
Subscribe - trendoscope.io/pricing
Blog - docs.trendoscope.io
Subscribe - trendoscope.io/pricing
Blog - docs.trendoscope.io
免责声明
这些信息和出版物并非旨在提供,也不构成TradingView提供或认可的任何形式的财务、投资、交易或其他类型的建议或推荐。请阅读使用条款了解更多信息。