OPEN-SOURCE SCRIPT
Revolution SMA-EMA Divergence
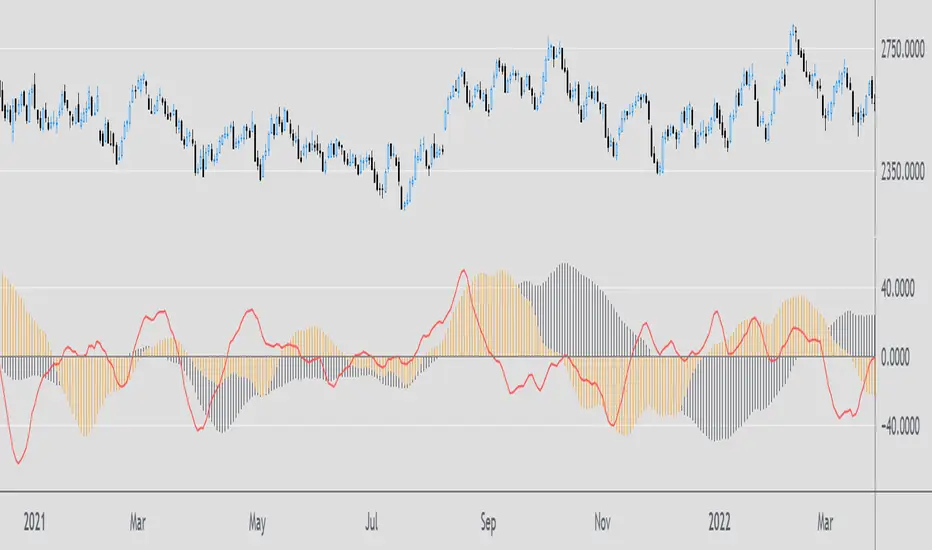
This is an MACD inspired indicator and it analyzes the difference between the SMA and EMA using the same time period. Unlike the MACD, it can give you a better understanding of the overall trend. Values above 0 is bullish and below 0 bearish. It consists of two cycles: Black histogram - the long-term cycle and orange histogram - the short-term cycle, as well as timing signal (red line).
开源脚本
秉承TradingView的精神,该脚本的作者将其开源,以便交易者可以查看和验证其功能。向作者致敬!您可以免费使用该脚本,但请记住,重新发布代码须遵守我们的网站规则。
免责声明
这些信息和出版物并非旨在提供,也不构成TradingView提供或认可的任何形式的财务、投资、交易或其他类型的建议或推荐。请阅读使用条款了解更多信息。
开源脚本
秉承TradingView的精神,该脚本的作者将其开源,以便交易者可以查看和验证其功能。向作者致敬!您可以免费使用该脚本,但请记住,重新发布代码须遵守我们的网站规则。
免责声明
这些信息和出版物并非旨在提供,也不构成TradingView提供或认可的任何形式的财务、投资、交易或其他类型的建议或推荐。请阅读使用条款了解更多信息。