INVITE-ONLY SCRIPT
NKP Strength Meter
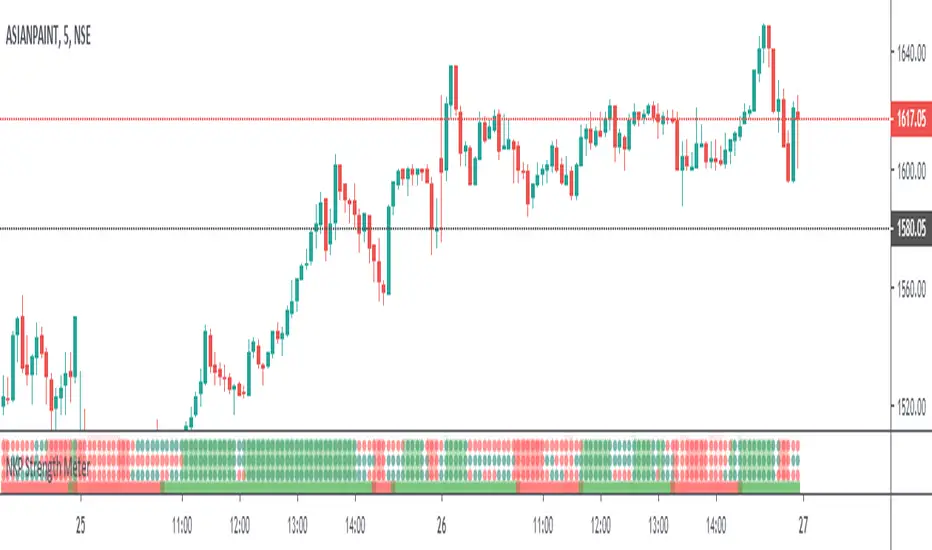
NKP Strength Meter is an indicator it will show the strength of the trend based on built-ins indicators like RSI , MACD , ADX , PSAR and some mathematical formulas. we can apply in any time frame. it is dynamically calculate the values based which time frame user got selected. By using this we can trend strength, read on. ( we can apply this in any time frame chart)
NKP Strength Meter has 3 main components:
one trend bar - it will plot only in two colors either Green or Red. Green indicates buy strength Red indicates sell strength.
three trend dotted lines - these also will plot only in two color either Red or Green. Green indicates buy strength Red indicates sell strength.
color plotted area - if all are in the Green it will plot the green background. all are in red it will plot the red background based these we can easily identify the strength of the trend while seeing the chart.
How does it work?
If all trend bar and dotted lines are green it means buyers strength is more.(continue with uptrend)
If all trend bar and dotted lines are red it means seller strength is more.(continue with downtrend)
mixed colors on dotted line and trend bar there is strength at that time.
What are the signals?
it wont generate any signals. just it will plot the strength dotted lines and trend bar it identify the strength of the trend.
Can we set the Alert on this?
No, it will use to see the strength of the trend while taking the order.(just for trend confirmation)
IMPORTANT: this script does not generate any signals. Perfectly catches long runs in trends at all underlings (stocks, indexes ) at any time frame.
Try it! Good luck and good trading!
For access, please PM us or visit the link below in our Signature.
仅限邀请脚本
只有作者授权的用户才能访问此脚本。您需要申请并获得使用许可。通常情况下,付款后即可获得许可。更多详情,请按照下方作者的说明操作,或直接联系NKPTechnicalTrader。
TradingView不建议您付费购买或使用任何脚本,除非您完全信任其作者并了解其工作原理。您也可以在我们的社区脚本找到免费的开源替代方案。
作者的说明
免责声明
这些信息和出版物并非旨在提供,也不构成TradingView提供或认可的任何形式的财务、投资、交易或其他类型的建议或推荐。请阅读使用条款了解更多信息。
仅限邀请脚本
只有作者授权的用户才能访问此脚本。您需要申请并获得使用许可。通常情况下,付款后即可获得许可。更多详情,请按照下方作者的说明操作,或直接联系NKPTechnicalTrader。
TradingView不建议您付费购买或使用任何脚本,除非您完全信任其作者并了解其工作原理。您也可以在我们的社区脚本找到免费的开源替代方案。
作者的说明
免责声明
这些信息和出版物并非旨在提供,也不构成TradingView提供或认可的任何形式的财务、投资、交易或其他类型的建议或推荐。请阅读使用条款了解更多信息。