OPEN-SOURCE SCRIPT
已更新 Draw swing Lines based on SMA
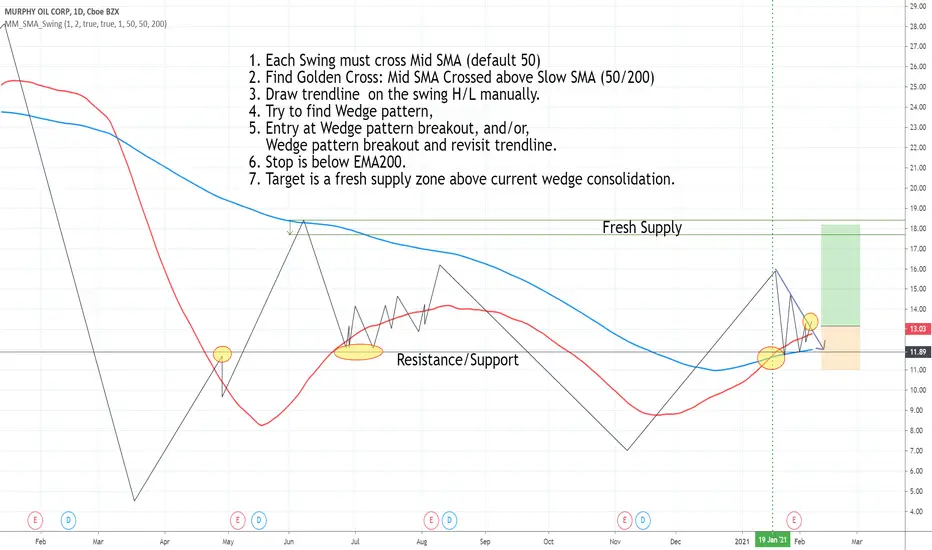
// Draw swing Lines based on SMA
// Each swing line must cross SMA
// ---------------------------------------------------
// Input:
// sma(Number): Default 50;
// showSMA: Default 'true'; if showSMA ='false', do not show SMA line;
// Deviation(%): Default "1"; To draw a new swing line, Price must cross SMA more than (n% of SMA)
// In weekly chart, better use "2" or more to avoid small ZigZag;
// ---------------------------------------------------
// This swing Lines could be used:
// 1. Verify reversal pattern, such as, double tops;
// 2. Help to draw accurate trend line, avoid noice; Set showSMA=false, to see trend line clearly;
// 3. Use two of this study together with different SMA, Set showSMA=false,
// Such as, SMA20 and SMA200, to see small waves in bigger wave
// ---------------------------------------------------
// In this sample Chart -- AMD 1h (Feb to Jun 2020)
// Added this study with SMA(50),
// Hide price chart and SMA line, to show the Swing line only,
// I drew some sample trend lines, and identified one Double top;
版本注释
Add SMA 200 to help verify trend. when SMA50>SMA200, it is uptrend.版本注释
Add SMA200 to show SMA50/200 relation for trend direction. 版本注释
Add SMA200, To find Golden cross for long entry.开源脚本
秉承TradingView的精神,该脚本的作者将其开源,以便交易者可以查看和验证其功能。向作者致敬!您可以免费使用该脚本,但请记住,重新发布代码须遵守我们的网站规则。
免责声明
这些信息和出版物并非旨在提供,也不构成TradingView提供或认可的任何形式的财务、投资、交易或其他类型的建议或推荐。请阅读使用条款了解更多信息。
开源脚本
秉承TradingView的精神,该脚本的作者将其开源,以便交易者可以查看和验证其功能。向作者致敬!您可以免费使用该脚本,但请记住,重新发布代码须遵守我们的网站规则。
免责声明
这些信息和出版物并非旨在提供,也不构成TradingView提供或认可的任何形式的财务、投资、交易或其他类型的建议或推荐。请阅读使用条款了解更多信息。