OPEN-SOURCE SCRIPT
已更新 Bands Vision-X
Bands Vision-X (BB-Vision-X) – Full Description
Description:
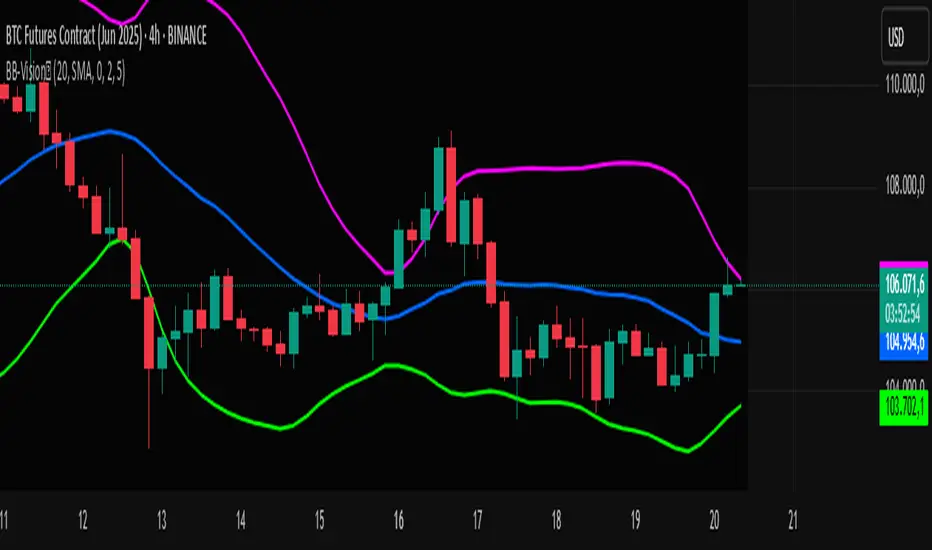
Bands Vision-X is an indicator based on dynamic bands constructed from customizable moving averages and standard deviation, allowing you to visualize potential support and resistance zones, volatility, and market conditions. It uses an adjustable moving average (with multiple options such as SMA, EMA, WMA, JMA, LSMA, DEMA, and TEMA) to define the central line, and upper and lower bands calculated by standard deviation multiplied by an adjustable factor. The bands are smoothed by a Hull Moving Average (HMA) to reduce noise and improve clarity.
How to Use
The bands indicate potential support and resistance levels.
The central line serves as a dynamic price reference.
The distance between bands reflects market volatility.
Touches or breakouts of the bands may signal entry or exit opportunities.
Parameters
Parameter Description Default
Standard Error Band Period Period for moving average and standard deviation 20
Moving Average Type Type of moving average (SMA, EMA, etc.) SMA
Standard Deviation Multiplier Multiplier for standard deviation 2.0
Band Lines Smoothing Period Period for smoothing the bands (HMA) 5
Technical Notes
The JMA function used is not the original Jurik version but an approximate and open implementation based on publicly available TradingView community code.
Developed in Pine Script v6 with optimized and clean code.
Recommendations
Ideal for traders seeking a clear view of volatility and dynamic support/resistance levels.
Should not be used in isolation; it is recommended to combine with volume analysis, price action, or other technical indicators.
Adjust the period and multiplier according to the asset and timeframe for better effectiveness.
Description:
Bands Vision-X is an indicator based on dynamic bands constructed from customizable moving averages and standard deviation, allowing you to visualize potential support and resistance zones, volatility, and market conditions. It uses an adjustable moving average (with multiple options such as SMA, EMA, WMA, JMA, LSMA, DEMA, and TEMA) to define the central line, and upper and lower bands calculated by standard deviation multiplied by an adjustable factor. The bands are smoothed by a Hull Moving Average (HMA) to reduce noise and improve clarity.
How to Use
The bands indicate potential support and resistance levels.
The central line serves as a dynamic price reference.
The distance between bands reflects market volatility.
Touches or breakouts of the bands may signal entry or exit opportunities.
Parameters
Parameter Description Default
Standard Error Band Period Period for moving average and standard deviation 20
Moving Average Type Type of moving average (SMA, EMA, etc.) SMA
Standard Deviation Multiplier Multiplier for standard deviation 2.0
Band Lines Smoothing Period Period for smoothing the bands (HMA) 5
Technical Notes
The JMA function used is not the original Jurik version but an approximate and open implementation based on publicly available TradingView community code.
Developed in Pine Script v6 with optimized and clean code.
Recommendations
Ideal for traders seeking a clear view of volatility and dynamic support/resistance levels.
Should not be used in isolation; it is recommended to combine with volume analysis, price action, or other technical indicators.
Adjust the period and multiplier according to the asset and timeframe for better effectiveness.
版本注释
Update: RGB colors were added to the lines. The background color is black with an adjustable offset from 0 to 20 (I use 4, but it’s up to you). To avoid using the background color directly, a transparency from 100 (fully transparent) to 0 is applied. Setting the transparency to 0 effectively disables the background color.版本注释
Update colors thanks 版本注释
update: We made an update by adding signal dots to help better interpret the signals of the Bands Bollinger indicator.版本注释
Update and improvements to the indicator开源脚本
秉承TradingView的精神,该脚本的作者将其开源,以便交易者可以查看和验证其功能。向作者致敬!您可以免费使用该脚本,但请记住,重新发布代码须遵守我们的网站规则。
免责声明
这些信息和出版物并非旨在提供,也不构成TradingView提供或认可的任何形式的财务、投资、交易或其他类型的建议或推荐。请阅读使用条款了解更多信息。
开源脚本
秉承TradingView的精神,该脚本的作者将其开源,以便交易者可以查看和验证其功能。向作者致敬!您可以免费使用该脚本,但请记住,重新发布代码须遵守我们的网站规则。
免责声明
这些信息和出版物并非旨在提供,也不构成TradingView提供或认可的任何形式的财务、投资、交易或其他类型的建议或推荐。请阅读使用条款了解更多信息。