OPEN-SOURCE SCRIPT
Weighted Moving Average Indicator (WMAI) 50/100/200 SMA + 21 EMA
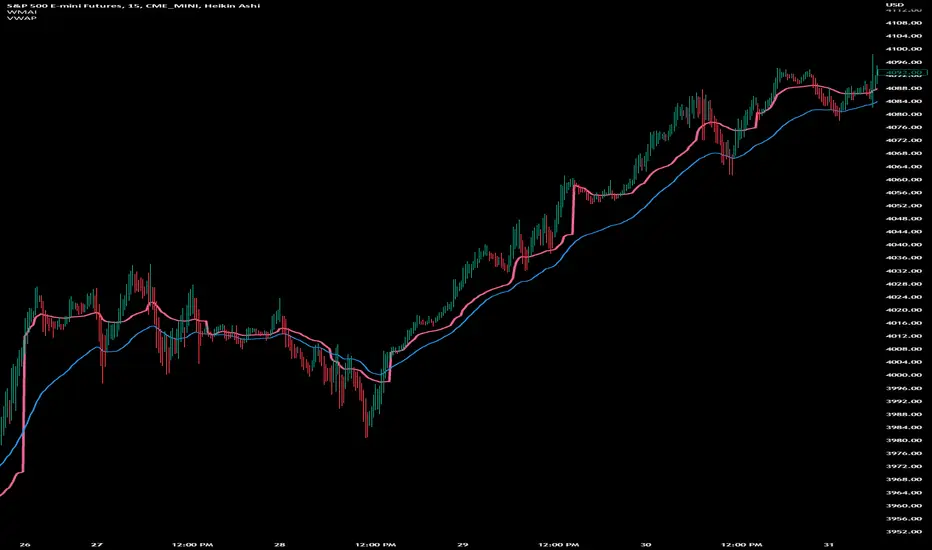
The Weighted Moving Average Indicator (WMAI) is a custom technical analysis tool that combines the information from three Simple Moving Averages (SMA) and one Exponential Moving Average (EMA) to create a single line on the chart. This line can be used to identify trends, potential entry and exit points, and overall market direction. Here's how to use this indicator:
Identifying trends: When the WMAI line is moving upwards, it signals a bullish trend, meaning that the asset's price is generally increasing. Conversely, when the WMAI line is moving downwards, it signals a bearish trend, indicating that the asset's price is generally decreasing. A flat WMAI line suggests a sideways or consolidating market.
Potential entry and exit points: You can use the WMAI line in combination with the asset's price or other technical indicators to identify potential entry and exit points for trades. For example, when the price crosses above the WMAI line, it might be considered a buy signal, as it suggests a potential upward trend. Conversely, when the price crosses below the WMAI line, it might be considered a sell signal, indicating a potential downward trend. Keep in mind that, like any other indicator, WMAI is not foolproof and should be used in conjunction with other technical analysis tools and techniques to increase the chances of successful trades.
Support and resistance levels: The WMAI line can act as a dynamic support and resistance level. When the price is above the WMAI line, the line can act as a support level, making it less likely for the price to drop below the line. Conversely, when the price is below the WMAI line, it can act as a resistance level, making it harder for the price to rise above the line.
Confirming signals from other indicators: You can use the WMAI line to confirm signals from other technical analysis tools. For instance, if you use a momentum oscillator like the Relative Strength Index (RSI) to identify overbought or oversold conditions, you can look for confluence with the WMAI line. If the WMAI line is also pointing in the same direction as the RSI signal, it can add confidence to the trade.
开源脚本
本着TradingView的真正精神,此脚本的创建者将其开源,以便交易者可以查看和验证其功能。向作者致敬!虽然您可以免费使用它,但请记住,重新发布代码必须遵守我们的网站规则。
免责声明
这些信息和出版物并不意味着也不构成TradingView提供或认可的金融、投资、交易或其它类型的建议或背书。请在使用条款阅读更多信息。
开源脚本
本着TradingView的真正精神,此脚本的创建者将其开源,以便交易者可以查看和验证其功能。向作者致敬!虽然您可以免费使用它,但请记住,重新发布代码必须遵守我们的网站规则。
免责声明
这些信息和出版物并不意味着也不构成TradingView提供或认可的金融、投资、交易或其它类型的建议或背书。请在使用条款阅读更多信息。