PROTECTED SOURCE SCRIPT
已更新 PVA Volume
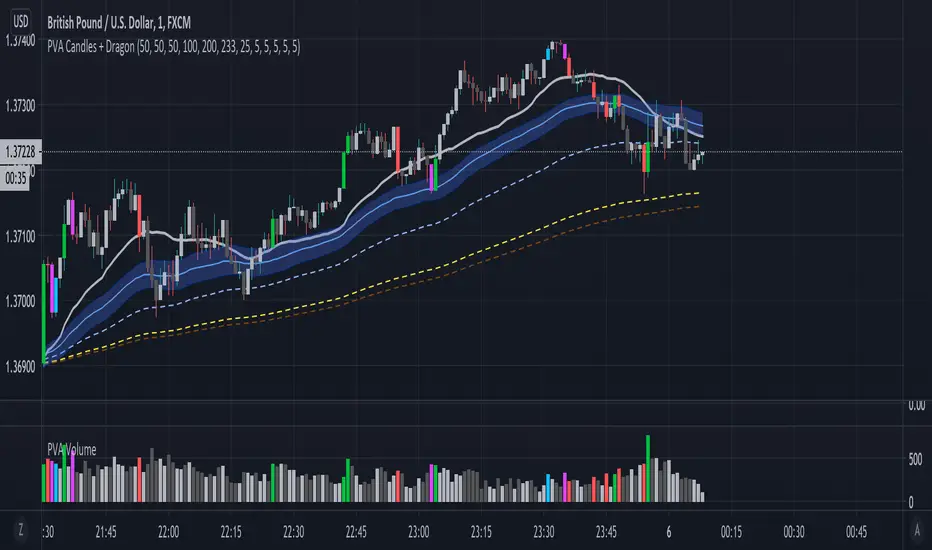
The PVA volume is part of PVSRA and it shows different bar colors according to the conditions below.
Situation "Climax". When volume >= 200% of the average volume of the 10
previous chart candles or where the product of candle spread x candle volume is >= the
highest for the 10 previous chart candles. Default Colors: Bullish bars are green and
Bearish bars are red.
Situation "Volume Rising Above Average". When volume >= 150% of the average
volume of the 10 previous chart candles. Default Colors: Bullish bars are blue and bearish bars are
blue-violet.
版本注释
I changed the transparency to zero so that the volume bar becomes more visible and so that it resembles the original PVSRA script.受保护脚本
此脚本以闭源形式发布。 但是,您可以自由使用,没有任何限制 — 了解更多信息这里。
免责声明
这些信息和出版物并非旨在提供,也不构成TradingView提供或认可的任何形式的财务、投资、交易或其他类型的建议或推荐。请阅读使用条款了解更多信息。
免责声明
这些信息和出版物并非旨在提供,也不构成TradingView提供或认可的任何形式的财务、投资、交易或其他类型的建议或推荐。请阅读使用条款了解更多信息。