OPEN-SOURCE SCRIPT
GSD by MATA
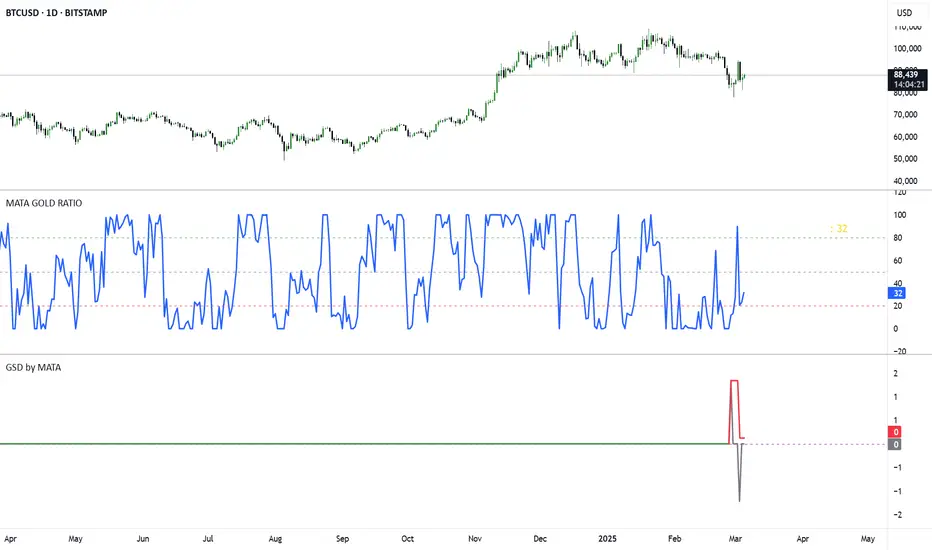
GSD by MATA - Gold-Sensitive Divergence Indicator
Overview:
The GSD by MATA indicator is designed to analyze the inverse correlation between an instrument’s price movement and gold (XAU/USD) over a selected time period. It helps traders identify whether the instrument tends to move in the opposite direction of gold, providing insights into potential hedging opportunities or market sentiment shifts.
How It Works:
User-Defined Time Period:
The user selects a time frame for comparison (1 Day, 1 Week, 1 Month, 3 Months, 6 Months, or 12 Months).
The indicator calculates the percentage change in both the instrument’s price and gold price over this period.
Inverse Movement Calculation:
If gold increases and the instrument decreases, the indicator registers a negative inverse change.
If gold decreases and the instrument increases, the indicator registers a positive inverse change.
If both move in the same direction, no inverse movement is recorded.
Cumulative Tracking:
The Reverse Change line shows the instant inverse movement.
The Total Change line accumulates the inverse movements over time, helping traders spot trends and long-term divergences.
How to Use:
A rising Total Change line (green) suggests that the instrument frequently moves in the opposite direction of gold, indicating a possible hedge effect.
A falling Total Change line (red) means the instrument has been moving in sync with gold rather than diverging.
The 0 reference line helps identify whether the cumulative effect is positive or negative over time.
开源脚本
秉承TradingView的精神,该脚本的作者将其开源,以便交易者可以查看和验证其功能。向作者致敬!您可以免费使用该脚本,但请记住,重新发布代码须遵守我们的网站规则。
免责声明
这些信息和出版物并非旨在提供,也不构成TradingView提供或认可的任何形式的财务、投资、交易或其他类型的建议或推荐。请阅读使用条款了解更多信息。
免责声明
这些信息和出版物并非旨在提供,也不构成TradingView提供或认可的任何形式的财务、投资、交易或其他类型的建议或推荐。请阅读使用条款了解更多信息。