PROTECTED SOURCE SCRIPT
Investment Bottom Indicator
Want to know when the market has reached near bottom in selloff or bearish trend?
You now have a perfect indicator for that - "Investment Bottom Indicator"
How to use?
Chart Setup-
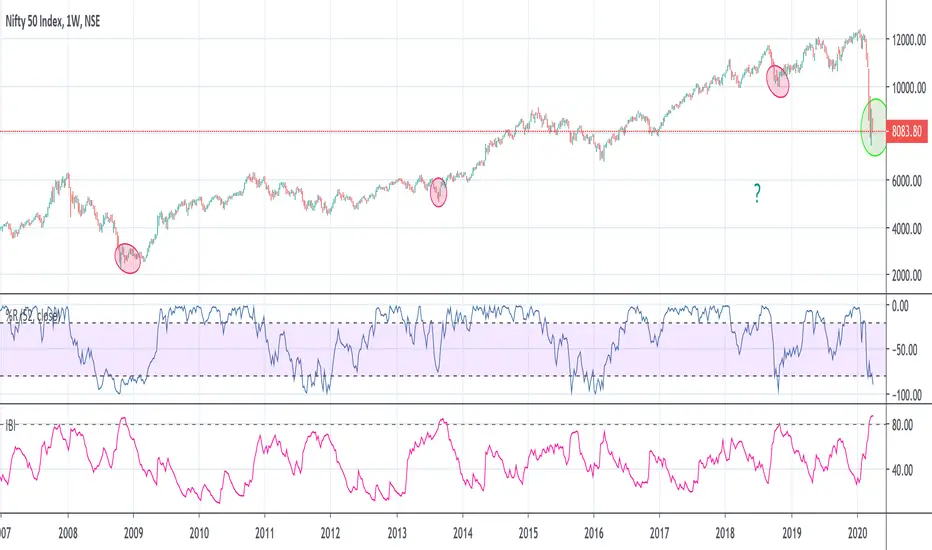
Step 1- Add your index symbol
Step 2- Change the time frame to weekly (candle sticks)
Step 3- Add William %R - settings: Period- 52, Close
Step 4- Add this indicator - Investment Bottom Indicator
Analysis-
When the William %R value is below -80 & Investment Bottom Indicator value is above 80 : this indicates that the market is near its bottom and if you have not yet started investing yet, this is the right time before the market flies off (in very few weeks/months) & you miss the bus!
You now have a perfect indicator for that - "Investment Bottom Indicator"
How to use?
Chart Setup-
Step 1- Add your index symbol
Step 2- Change the time frame to weekly (candle sticks)
Step 3- Add William %R - settings: Period- 52, Close
Step 4- Add this indicator - Investment Bottom Indicator
Analysis-
When the William %R value is below -80 & Investment Bottom Indicator value is above 80 : this indicates that the market is near its bottom and if you have not yet started investing yet, this is the right time before the market flies off (in very few weeks/months) & you miss the bus!
受保护脚本
此脚本以闭源形式发布。 但是,您可以自由使用,没有任何限制 — 了解更多信息这里。
免责声明
这些信息和出版物并非旨在提供,也不构成TradingView提供或认可的任何形式的财务、投资、交易或其他类型的建议或推荐。请阅读使用条款了解更多信息。
免责声明
这些信息和出版物并非旨在提供,也不构成TradingView提供或认可的任何形式的财务、投资、交易或其他类型的建议或推荐。请阅读使用条款了解更多信息。