OPEN-SOURCE SCRIPT
Kill Zone Max Volume Candle Lines
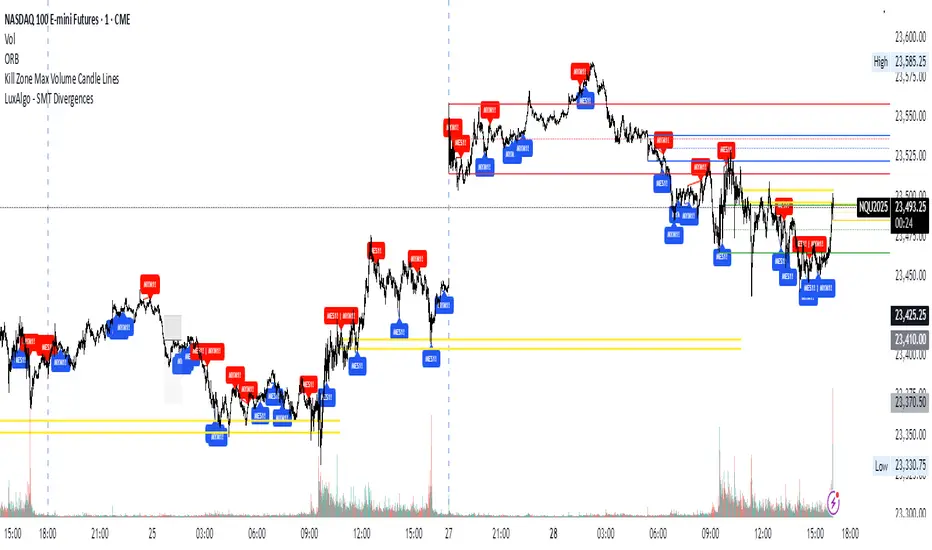
The Kill Zone Max Volume Lines indicator identifies the highest-volume candle within four key market sessions (Asia, London, NY AM, NY PM) and plots horizontal lines at its high, low, and midpoint levels, extended to the right.
Designed for traders targeting zones of heightened activity, this indicator highlights dynamic support and resistance levels based on volume—ideal for breakout or bounce strategies during highly volatile periods known as “kill zones.”
Perfect for indices such as Nasdaq (NQ), S&P 500 (SP), and Dow Jones (YM) on 15-minute or higher timeframes.
开源脚本
本着TradingView的真正精神,此脚本的创建者将其开源,以便交易者可以查看和验证其功能。向作者致敬!虽然您可以免费使用它,但请记住,重新发布代码必须遵守我们的网站规则。
免责声明
这些信息和出版物并不意味着也不构成TradingView提供或认可的金融、投资、交易或其它类型的建议或背书。请在使用条款阅读更多信息。
免责声明
这些信息和出版物并不意味着也不构成TradingView提供或认可的金融、投资、交易或其它类型的建议或背书。请在使用条款阅读更多信息。