OPEN-SOURCE SCRIPT
Bollinger Bands (with Width/GaUGE)
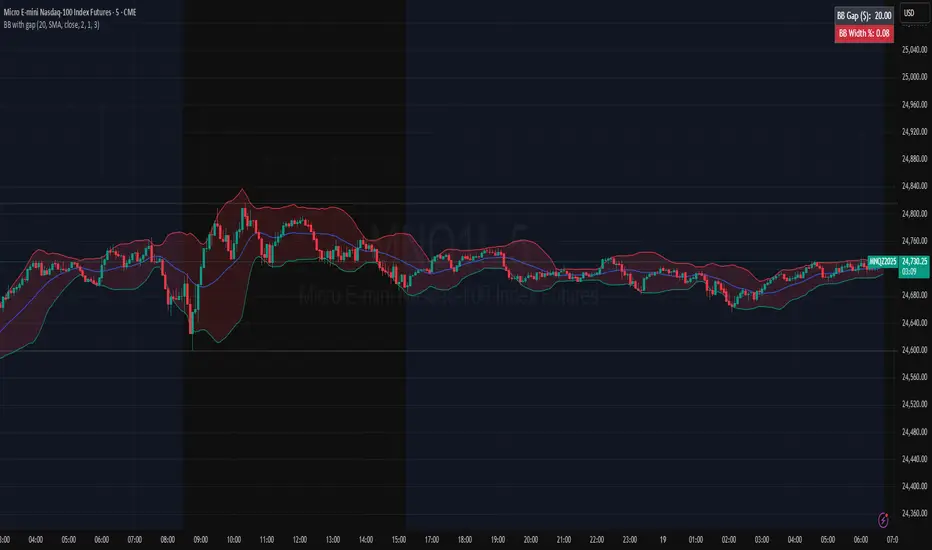
This overlay plots standard Bollinger Bands and makes volatility obvious. The fill between bands is color-coded by band width (tight = red “squeeze”, wide = teal “expansion”, mid = yellow). A compact table (top-right) shows live BB Gap ($) and BB Width (%), and the width also appears in the status line. Thresholds for squeeze/expansion are user-set. Use it to avoid low-volatility chop and time breakouts when width expands.
开源脚本
本着TradingView的真正精神,此脚本的创建者将其开源,以便交易者可以查看和验证其功能。向作者致敬!虽然您可以免费使用它,但请记住,重新发布代码必须遵守我们的网站规则。
免责声明
这些信息和出版物并不意味着也不构成TradingView提供或认可的金融、投资、交易或其它类型的建议或背书。请在使用条款阅读更多信息。
免责声明
这些信息和出版物并不意味着也不构成TradingView提供或认可的金融、投资、交易或其它类型的建议或背书。请在使用条款阅读更多信息。