PROTECTED SOURCE SCRIPT
已更新 NimblrTA InSwing Public 1.0 (Beta)
Hey Folks!
Presenting you the NimblrTA InSwing Beta Template.
This indicator is specifically to be used for Intraday (Time Frame 5M or 3M ) and Swing Trades (Time Frame 30M), that’s why the name “Intraday + Swing (InSwing)”
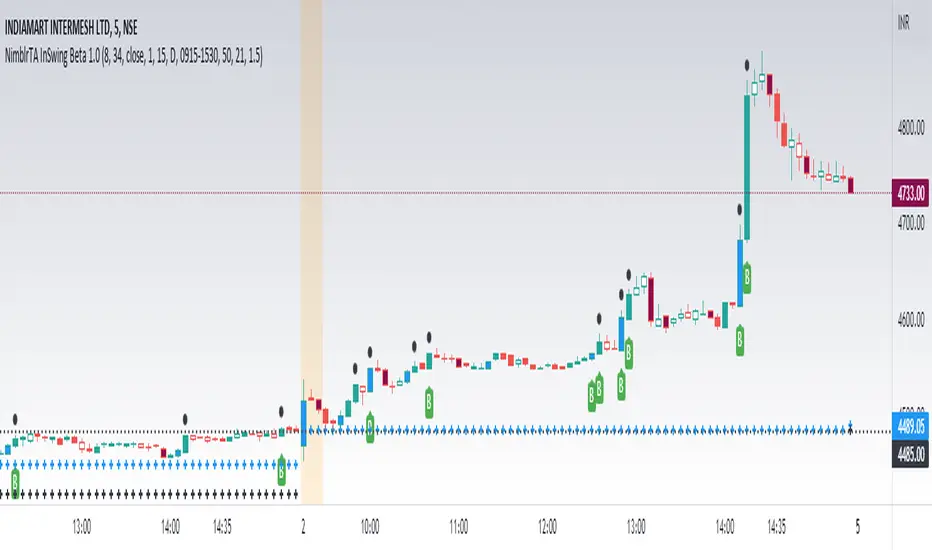
This script has taken in to concept of NimblrTA which is a combination of Candlestick ( IC / MC Breakout) + Multi timeframe CCI + Ascending/Descending Waves & Previous day high/low values.
Blue Line denotes previous day high
Orange Line denotes previous day low
Black line denotes Intraday Open
The Black dot is plotted above and below momentum candle which tells that there is volume support in momentum candle.
The white body candles are Indecision candles ( IC ), Red & Green body candles are momentum candles ( MC ) in the price flow. Blue candle is IC / MC Breakout up & Maroon candle is IC / MC Breakout down.
Template plots Buy & Sell Signal for easy tracking. All trades get ripe from Intraday so this template will help in timing the entries on real time rather than eod signals.
Later you can align Daily & Weekly TF for Medium to Longer term holding.
Alert option is also added so you can set Buy & Sell alert for easy tracking on your watch listed stocks.
The first Buy & Sell Signal is provisional and gets confirmed with second signal in the template. After that all signals are just adding the strength in the momentum you can use it for pyramiding or ignore it.
Pls note if you are swing trading on 30M TF then first buy/sell signal is enough to build positions don’t wait for confirmatory second signal.
Protip: whenever stock is in sell momentum from last 2-3 days and fresh buy is generated intraday, it’s a clear sign of quick change in trend.
Please note that you need to take Nimblr Waves concept (Overlaps & Impulse) in consideration along with Buy & Sell alerts/signal which is basic requirement to understand the structure of the trend.
For waves tracking (i.e HH, HL, LH & LL )you can use below zig zag indicator
Higher High Lower Low - Live
Following settings you can configure: Period 10, Source: Close/Open
After confirmatory Buy & Sell signal there can be chance stocks gives a Pullback so you can use Nimblr Wave concept to check pullback. Easiest way to check pullback is after confirmatory signal stocks pullback and takes support/resistance near previous day high/low or Intra open. Kindly use this template on decent volume stocks for proper signals.
Pls keep risk management in check and have proper money management plan while trading. After Buy/Sell signal stop loss you can use is Low/High of the day or Previous day close.
Any queries/suggestions do post on Trading View Forum.
Presenting you the NimblrTA InSwing Beta Template.
This indicator is specifically to be used for Intraday (Time Frame 5M or 3M ) and Swing Trades (Time Frame 30M), that’s why the name “Intraday + Swing (InSwing)”
This script has taken in to concept of NimblrTA which is a combination of Candlestick ( IC / MC Breakout) + Multi timeframe CCI + Ascending/Descending Waves & Previous day high/low values.
Blue Line denotes previous day high
Orange Line denotes previous day low
Black line denotes Intraday Open
The Black dot is plotted above and below momentum candle which tells that there is volume support in momentum candle.
The white body candles are Indecision candles ( IC ), Red & Green body candles are momentum candles ( MC ) in the price flow. Blue candle is IC / MC Breakout up & Maroon candle is IC / MC Breakout down.
Template plots Buy & Sell Signal for easy tracking. All trades get ripe from Intraday so this template will help in timing the entries on real time rather than eod signals.
Later you can align Daily & Weekly TF for Medium to Longer term holding.
Alert option is also added so you can set Buy & Sell alert for easy tracking on your watch listed stocks.
The first Buy & Sell Signal is provisional and gets confirmed with second signal in the template. After that all signals are just adding the strength in the momentum you can use it for pyramiding or ignore it.
Pls note if you are swing trading on 30M TF then first buy/sell signal is enough to build positions don’t wait for confirmatory second signal.
Protip: whenever stock is in sell momentum from last 2-3 days and fresh buy is generated intraday, it’s a clear sign of quick change in trend.
Please note that you need to take Nimblr Waves concept (Overlaps & Impulse) in consideration along with Buy & Sell alerts/signal which is basic requirement to understand the structure of the trend.
For waves tracking (i.e HH, HL, LH & LL )you can use below zig zag indicator
Higher High Lower Low - Live
Following settings you can configure: Period 10, Source: Close/Open
After confirmatory Buy & Sell signal there can be chance stocks gives a Pullback so you can use Nimblr Wave concept to check pullback. Easiest way to check pullback is after confirmatory signal stocks pullback and takes support/resistance near previous day high/low or Intra open. Kindly use this template on decent volume stocks for proper signals.
Pls keep risk management in check and have proper money management plan while trading. After Buy/Sell signal stop loss you can use is Low/High of the day or Previous day close.
Any queries/suggestions do post on Trading View Forum.
版本注释
There was some bug in plotting previous day high & low, which is been updated.版本注释
Update:Tiny IC plotting is added.
受保护脚本
此脚本以闭源形式发布。 但是,您可以自由使用,没有任何限制 — 了解更多信息这里。
免责声明
这些信息和出版物并非旨在提供,也不构成TradingView提供或认可的任何形式的财务、投资、交易或其他类型的建议或推荐。请阅读使用条款了解更多信息。
免责声明
这些信息和出版物并非旨在提供,也不构成TradingView提供或认可的任何形式的财务、投资、交易或其他类型的建议或推荐。请阅读使用条款了解更多信息。