INVITE-ONLY SCRIPT
已更新 Squeeze OBV
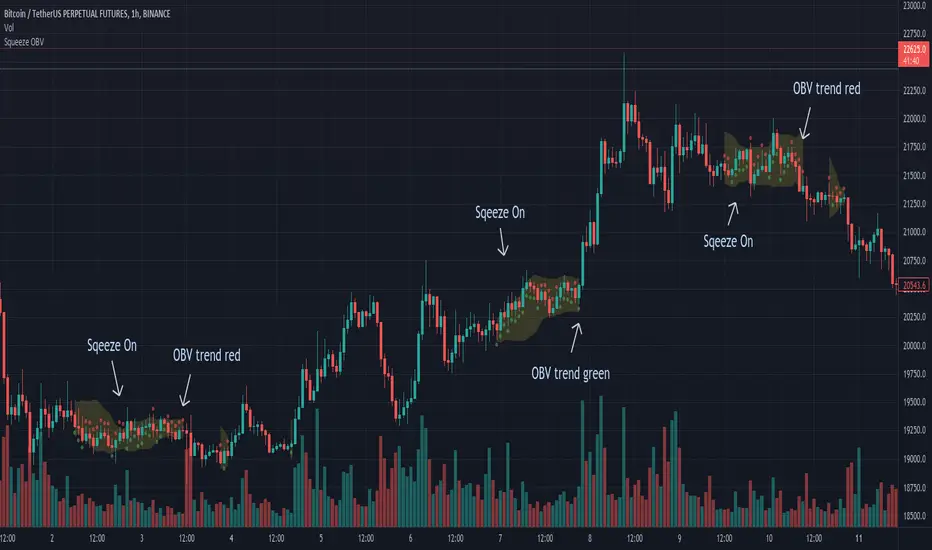
The concept comes from "TTM Squeeze", this indicator visualizes the squeeze on the price movement.
Yellow band overlay on the candles shows that entered a squeeze on with low volatility, market preparing itself for an large move (up or down).
Dots of OBV change every bar, green means potential up, red is the opposite.
Prepare a breakout order with the direction of OBV.
If potential up, the strategy is a breakout order above the squeezed Bollinger Band and the stop loss is below the Bollinger Band.
It's a pity that it cannot write breakout order strategy in Tradingview.
My experience that use CVD instead of OBV will have better performance, but it needs the historical evolution of the order book.
----
概念來自於 "TTM Squeeze",將擠壓的過程視覺化在價格走勢上。
k線上的黃色帶覆蓋表明進入了低波動性的擠壓,市場為大幅波動(向上或向下)做準備。
OBV 的點每根bar都會變化,綠色表示可能向上,紅色則相反。
搭配 OBV 可以判斷走勢,使用突破單策略能夠有效獲利,
假設可能向上,突破單在擠壓布林帶上方,止損在布林帶下方。
可惜 Tradingview 無法寫突破單策略回測。
經驗上搭配 CVD 更有效,需要交易所訂單簿的歷史紀錄,故 Tradingview 也無法製作 CVD。
版本注释
add an option to show KC & BB original版本注释
update a screenshot when the option enabled in the chart.版本注释
It will look at the 1 min timeframes and approximate CVD with better predictions.----
使用1分鐘的時框來模擬近似CVD,能有較佳的預測。
仅限邀请脚本
只有经作者批准的用户才能访问此脚本。您需要申请并获得使用权限。该权限通常在付款后授予。如需了解更多详情,请按照以下作者的说明操作,或直接联系sevenjay。
除非您完全信任其作者并了解脚本的工作原理,否則TradingView不建议您付费或使用脚本。您还可以在我们的社区脚本中找到免费的开源替代方案。
作者的说明
Try 1 month free, fill out the form in English: https://forms.gle/cchyAvY4BX3VhoRw8 .
|
申請一個月免費試用的中文表格: https://forms.gle/YeyFkZSn8QPZjZBU6
免责声明
这些信息和出版物并不意味着也不构成TradingView提供或认可的金融、投资、交易或其它类型的建议或背书。请在使用条款阅读更多信息。