INVITE-ONLY SCRIPT
Icy-Hot Visual Indicator [SciQua]
🧊 Icy-Hot Visual Indicator [SciQua]
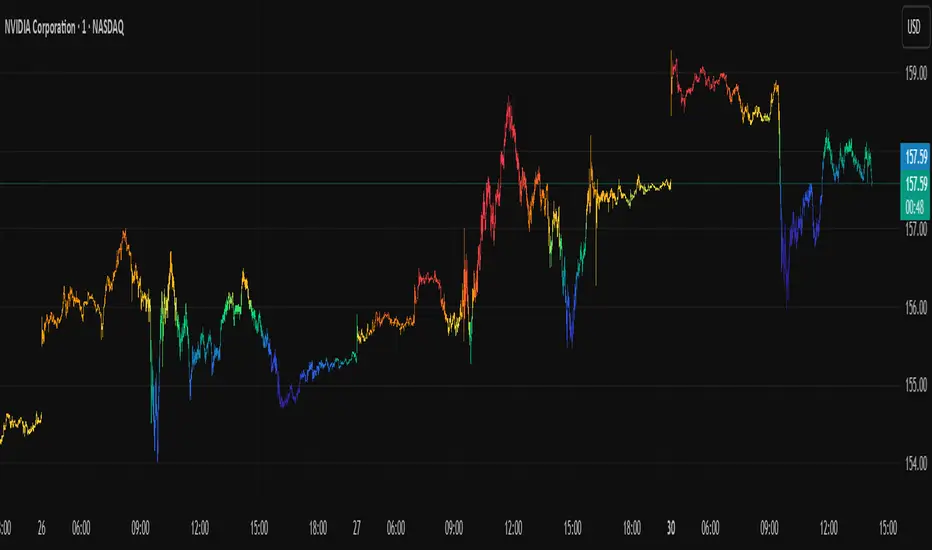
This indicator colors your price bars and/or chart background based on a normalized & smoothed transform of any price-based input (default: close). It gives you a quick “temperature map” of market momentum or volatility—cool blues for low readings, hot reds for high readings—without cluttering your chart.
🔍 Key Features
1. Dual Visual Layers
2. Advanced Customization
3. Gradient Control: Choose 2–7 color stops, reverse direction, adjust display length
❓How It Works
Inputs are normalized (z-score, bounded, etc.) then smoothed (EMA, LinReg, etc.) in the order you choose. The result is clamped to 0–1 and passed through a multi-stop gradient engine for precise color mapping.
✨ What Makes It Original
While many indicators apply colors or smoothing, this script combines multi-stage normalization, adaptive smoothing, and a modular gradient rendering engine in a highly customizable dual-layer system. It’s built using proprietary functions from the SciQua suite that are not available in public libraries and allow for advanced visual encoding without relying on alerts, signals, or extra panes.
This makes it original in both design and execution—offering a visual-first approach with unique depth, clarity, and flexibility.
🔐 Why This Script Is Closed-Source
While the underlying functions are published in the open-source SciQua library, this indicator’s specific implementation, configuration architecture, and visual behavior are proprietary. It combines multiple library utilities into a dual-layer adaptive system that handles advanced gradient rendering, multi-stage normalization, and smoothing pipelines in a unique way.
The source is closed to protect the design logic, interface abstraction, and fine-tuned behaviors that make this indicator commercially valuable. The building blocks are open to the Pine community, but this assembled product is not meant for replication or redistribution.
How to Use It
1. Highlight Trend Strength
2. Visualize Volatility Regimes
3. Combine with Other Indicators
4. Background Only Heatmap
This indicator colors your price bars and/or chart background based on a normalized & smoothed transform of any price-based input (default: close). It gives you a quick “temperature map” of market momentum or volatility—cool blues for low readings, hot reds for high readings—without cluttering your chart.
🔍 Key Features
1. Dual Visual Layers
- Candle Gradient: Applies a smooth, multi-color gradient to candle bodies and wicks based on normalized, smoothed input data
- Background Gradient: Adds a semi-transparent gradient behind the candles to highlight broader trend zones or volatility regimes
2. Advanced Customization
- Normalization Types: bounded, unbounded, z-score, MAD, percentile, sigmoid, tanh, rank, robust, and more
- Smoothing Methods: EMA, SMA, WMA, RMA, HMA, TEMA, VWMA, Gaussian, LinReg, ExpReg, and others (12+ options)
3. Gradient Control: Choose 2–7 color stops, reverse direction, adjust display length
- Flexible Source Inputs
- Use any built-in price series (close, hl2, volume, etc.)
- Feed outputs from external indicators (RSI, custom oscillators, moving averages) into either layer
❓How It Works
Inputs are normalized (z-score, bounded, etc.) then smoothed (EMA, LinReg, etc.) in the order you choose. The result is clamped to 0–1 and passed through a multi-stop gradient engine for precise color mapping.
✨ What Makes It Original
While many indicators apply colors or smoothing, this script combines multi-stage normalization, adaptive smoothing, and a modular gradient rendering engine in a highly customizable dual-layer system. It’s built using proprietary functions from the SciQua suite that are not available in public libraries and allow for advanced visual encoding without relying on alerts, signals, or extra panes.
This makes it original in both design and execution—offering a visual-first approach with unique depth, clarity, and flexibility.
🔐 Why This Script Is Closed-Source
While the underlying functions are published in the open-source SciQua library, this indicator’s specific implementation, configuration architecture, and visual behavior are proprietary. It combines multiple library utilities into a dual-layer adaptive system that handles advanced gradient rendering, multi-stage normalization, and smoothing pipelines in a unique way.
The source is closed to protect the design logic, interface abstraction, and fine-tuned behaviors that make this indicator commercially valuable. The building blocks are open to the Pine community, but this assembled product is not meant for replication or redistribution.
How to Use It
1. Highlight Trend Strength
- Source: RSI percentile
- Setup: 200-bar look-back, mild smoothing
- Result: Warm tones when momentum is peaking; cool when it’s fading. Use as a quick filter for entries in the direction of the trend.
2. Visualize Volatility Regimes
- Source: ATR or True Range
- Setup: Bounded normalization with tighter smoothing bar color off, bg color on.
- Result: Background bands that shade when volatility spikes. Helps you avoid low-volatility breakouts or throttle position sizing in choppy markets.
3. Combine with Other Indicators
- Source: Output of your custom indicator (e.g., a Keltner Band width)
- Setup: Match normalization period to your strategy’s timeframe
- Result: Bars colored by your own logic—no extra panes, just enhanced candles.
4. Background Only Heatmap
- Turn off bar coloring and dial in semi-transparent background shades—keeps candles crisp while still giving you a context heat-map behind price.
仅限邀请脚本
只有作者授权的用户才能访问此脚本。您需要申请并获得使用许可。通常情况下,付款后即可获得许可。更多详情,请按照下方作者的说明操作,或直接联系JoshuaDanford。
TradingView不建议您付费购买或使用任何脚本,除非您完全信任其作者并了解其工作原理。您也可以在我们的社区脚本找到免费的开源替代方案。
作者的说明
🔑 Access This Indicator
➡️ Visit sciqua.com
💳 Purchase a package with indicator access.
📩 Message @JoshuaDanford on TradingView with your username.
✅ Access granted within 72 hours.
🚀 Founder of SciQua | Strategy. Simulation. Signals.
TradingView indicators, backtesting tools, weekly contests, and live market analysis.
Join free, compete, win, and stay updated at sciqua.com
TradingView indicators, backtesting tools, weekly contests, and live market analysis.
Join free, compete, win, and stay updated at sciqua.com
免责声明
这些信息和出版物并非旨在提供,也不构成TradingView提供或认可的任何形式的财务、投资、交易或其他类型的建议或推荐。请阅读使用条款了解更多信息。