OPEN-SOURCE SCRIPT
M2 Growth Rate vs Borrowing Rate
Have you ever wondered how fast M2 is actually growing? Have you ever wanted to compare its percentage growth rate to the actual cost of borrowing? Are you also, like me, a giant nerd with too much time on your hands?
M2 Growth Rate vs Borrowing Rate
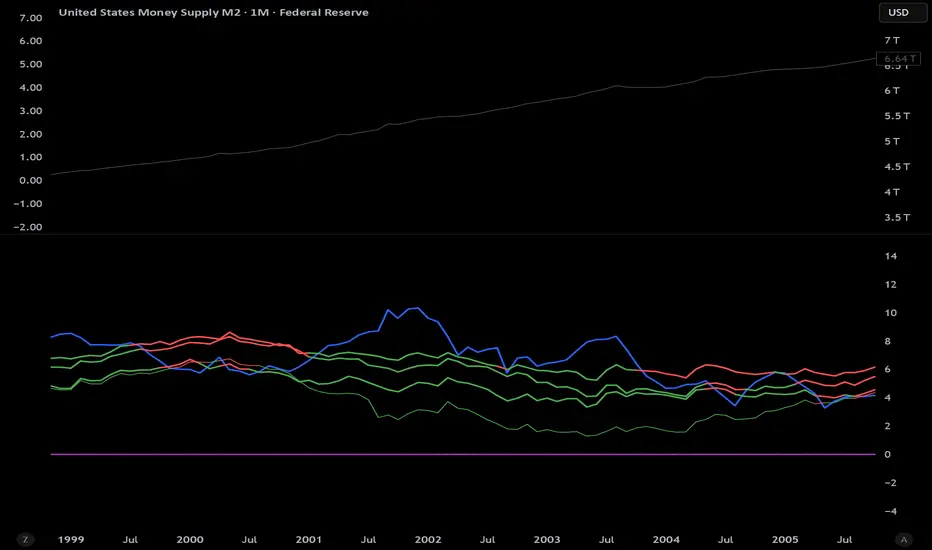
This Pine Script indicator analyzes the annualized growth rate of M2 money supply and compares it to key borrowing rates, providing insights into the relationship between money supply expansion and borrowing costs. Users can select between US M2 or a combined M2 (aggregating US, EU, China, Japan, and UK money supplies, adjusted for currency exchange rates). The M2 growth period is customizable, offering options from 1 month to 5 years for flexible analysis over different time horizons. The indicator fetches monthly data for US M2, EU M2, China M2, Japan M2, UK M2, and exchange rates (EURUSD, CNYUSD, JPYUSD, GBPUSD) to compute the combined M2 in USD terms.
It plots the annualized M2 growth rate alongside borrowing rates, including US 2-year and 10-year Treasury yields, corporate bond effective yield, high-yield bond effective yield, and 30-year US mortgage rates. Borrowing rates are color-coded for clarity: red if the rate exceeds the selected M2 growth rate, and green if below, highlighting relative dynamics. Displayed on a separate pane with a zero line for reference, the indicator includes labeled plots for easy identification.
This tool is designed for informational purposes, offering a visual framework to explore economic trends without providing trading signals or financial advice.
M2 Growth Rate vs Borrowing Rate
This Pine Script indicator analyzes the annualized growth rate of M2 money supply and compares it to key borrowing rates, providing insights into the relationship between money supply expansion and borrowing costs. Users can select between US M2 or a combined M2 (aggregating US, EU, China, Japan, and UK money supplies, adjusted for currency exchange rates). The M2 growth period is customizable, offering options from 1 month to 5 years for flexible analysis over different time horizons. The indicator fetches monthly data for US M2, EU M2, China M2, Japan M2, UK M2, and exchange rates (EURUSD, CNYUSD, JPYUSD, GBPUSD) to compute the combined M2 in USD terms.
It plots the annualized M2 growth rate alongside borrowing rates, including US 2-year and 10-year Treasury yields, corporate bond effective yield, high-yield bond effective yield, and 30-year US mortgage rates. Borrowing rates are color-coded for clarity: red if the rate exceeds the selected M2 growth rate, and green if below, highlighting relative dynamics. Displayed on a separate pane with a zero line for reference, the indicator includes labeled plots for easy identification.
This tool is designed for informational purposes, offering a visual framework to explore economic trends without providing trading signals or financial advice.
开源脚本
秉承TradingView的精神,该脚本的作者将其开源,以便交易者可以查看和验证其功能。向作者致敬!您可以免费使用该脚本,但请记住,重新发布代码须遵守我们的网站规则。
免责声明
这些信息和出版物并非旨在提供,也不构成TradingView提供或认可的任何形式的财务、投资、交易或其他类型的建议或推荐。请阅读使用条款了解更多信息。
开源脚本
秉承TradingView的精神,该脚本的作者将其开源,以便交易者可以查看和验证其功能。向作者致敬!您可以免费使用该脚本,但请记住,重新发布代码须遵守我们的网站规则。
免责声明
这些信息和出版物并非旨在提供,也不构成TradingView提供或认可的任何形式的财务、投资、交易或其他类型的建议或推荐。请阅读使用条款了解更多信息。