INVITE-ONLY SCRIPT
Trend Optimizer
What is this?
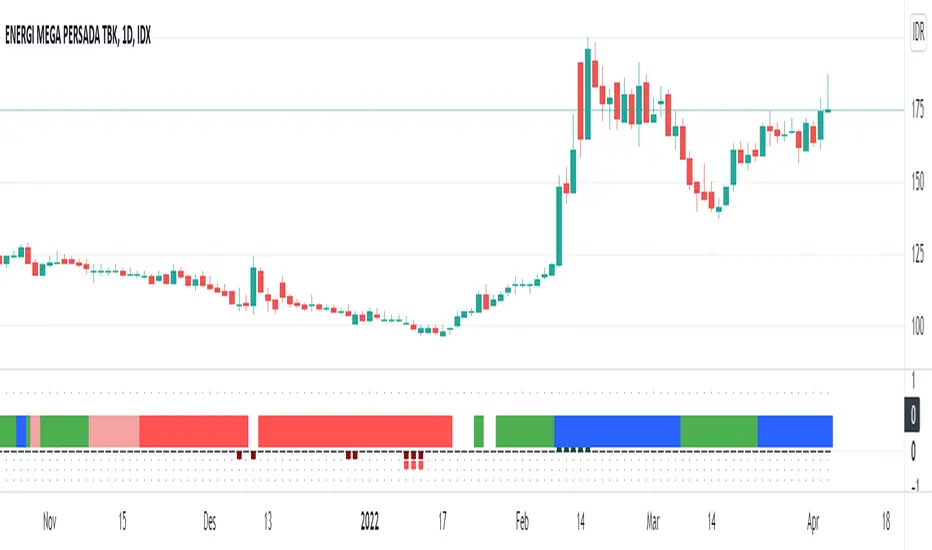
This horizontal trend color and vertical trend bar is a trend identification to optimize your positioning in the market. Colors helps you to understand the trend easily, spontaneously.
The indicators & Strategies?
1. A horizontal trend color which represents the medium term trend. The color change is based on the price position towards moving average. We exclude the moving averaged from chart area so the chart area will be clean and you'll have an easier interpretation. This trend color helps you to understand the major trend as simple as you see navigation maps in your smartphone. When the trend color changed from the long red into white, then green, then blue, it indicates a bottom reversal. This module will work best with out other module: Trend Optimizer Module and Momentum line Module.
2. A vertical trend bar represents long term trend. Bars that above the axis is an uptrend bar. If it occurs, the long term bullish trend is exists. Bars below the axis is a downtrend bar. If it occurs, the long term bearish trend is exists. If there is no bars (empty), means the long term trend is weakened but the trend still as same as the last bars occurrence.
Benefit for you:
You'll have a guidance the existing trend and the trend progress from time to time.
If you combine this script with our other two module: Profit Trader module & Momentum Line Module, You'll have a complete template to analyze both trend and swing strategies.
仅限邀请脚本
只有作者授权的用户才能访问此脚本。您需要申请并获得使用许可。通常情况下,付款后即可获得许可。更多详情,请按照下方作者的说明操作,或直接联系galerisaham。
TradingView不建议您付费购买或使用任何脚本,除非您完全信任其作者并了解其工作原理。您也可以在我们的社区脚本找到免费的开源替代方案。
作者的说明
To use this scipt, visit https://galerisaham.com/modul for further information.
We Build Profitable Traders | Visit: galerisaham.com/pro/
免责声明
这些信息和出版物并非旨在提供,也不构成TradingView提供或认可的任何形式的财务、投资、交易或其他类型的建议或推荐。请阅读使用条款了解更多信息。