OPEN-SOURCE SCRIPT
RSI and MACD Crossover Signals
Best for Short-Term/Intraday Trading on SPY, TSLA, NVDA
Strategy Concept:
This strategy is designed for short-term trading across various assets and timeframes (Recommend: 1min, 5min, 15min, 1hr, 4hr, 1day). It leverages the Relative Strength Index (RSI) and Moving Average Convergence Divergence (MACD) to identify potential buy and sell signals. The strategy aims to capture moments where the asset's price is likely to experience a reversal or a significant momentum shift.
By combining the RSI and MACD indicators, the strategy seeks to increase the accuracy of identifying potential trend reversals or continuations, taking into account both the momentum and the trend direction of the asset.
RSI (Relative Strength Index) Parameters:
MACD (Moving Average Convergence Divergence) Parameters:
Signal Generation Logic:
Buy Signal:
Sell Signal:
Additional Features:
The script includes a notification system that alerts the trader when either a buy or sell signal is detected. The alert signal is combined with both the buy and sell signal in 1 so people without premium can be alerted when any signal appears.
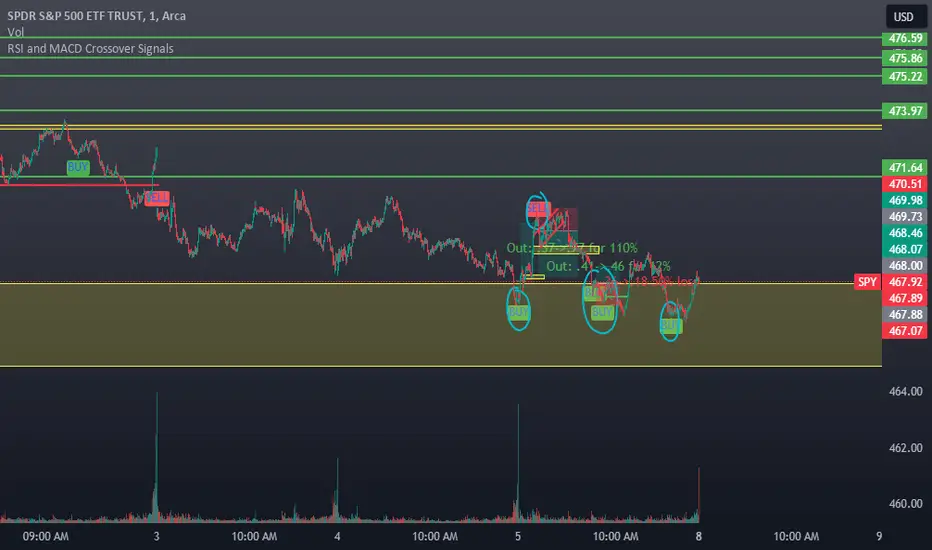
Buy signals are visually represented on the chart below the price bars with a green "BUY" label.
Sell signals are indicated above the price bars with a red "SELL" label.
Usage and Application:
This strategy is versatile and recommended to be played with scalps and day trades. I prefer SPY 0DTE on the 1 and 5 minute timeframe and looking for bigger trend reversals on the 1hr, 4hr, and 1 day timeframe.
Strategy Concept:
This strategy is designed for short-term trading across various assets and timeframes (Recommend: 1min, 5min, 15min, 1hr, 4hr, 1day). It leverages the Relative Strength Index (RSI) and Moving Average Convergence Divergence (MACD) to identify potential buy and sell signals. The strategy aims to capture moments where the asset's price is likely to experience a reversal or a significant momentum shift.
By combining the RSI and MACD indicators, the strategy seeks to increase the accuracy of identifying potential trend reversals or continuations, taking into account both the momentum and the trend direction of the asset.
RSI (Relative Strength Index) Parameters:
- The RSI period is set to 14
- Overbought and oversold levels are set at 70 and 30, respectively
- The RSI is used to identify potential reversal points when the asset is overbought or oversold
MACD (Moving Average Convergence Divergence) Parameters:
- The MACD settings are configured with a fast length of 8, a slow length of 34, and a signal smoothing of 8
- The MACD line crossing over or under the signal line is used to confirm the potential buy or sell signals indicated by the RSI
Signal Generation Logic:
Buy Signal:
- Triggered when the RSI crosses above the oversold level (30).
- Confirmed if the MACD line crosses above the signal line within a delay period of up to 4 candles after the RSI signal.
Sell Signal:
- Triggered when the RSI crosses below the overbought level (70).
- Confirmed if the MACD line crosses below the signal line within a delay period of up to 4 candles after the RSI signal.
Additional Features:
The script includes a notification system that alerts the trader when either a buy or sell signal is detected. The alert signal is combined with both the buy and sell signal in 1 so people without premium can be alerted when any signal appears.
Buy signals are visually represented on the chart below the price bars with a green "BUY" label.
Sell signals are indicated above the price bars with a red "SELL" label.
Usage and Application:
This strategy is versatile and recommended to be played with scalps and day trades. I prefer SPY 0DTE on the 1 and 5 minute timeframe and looking for bigger trend reversals on the 1hr, 4hr, and 1 day timeframe.
开源脚本
秉承TradingView的精神,该脚本的作者将其开源,以便交易者可以查看和验证其功能。向作者致敬!您可以免费使用该脚本,但请记住,重新发布代码须遵守我们的网站规则。
免责声明
这些信息和出版物并非旨在提供,也不构成TradingView提供或认可的任何形式的财务、投资、交易或其他类型的建议或推荐。请阅读使用条款了解更多信息。
免责声明
这些信息和出版物并非旨在提供,也不构成TradingView提供或认可的任何形式的财务、投资、交易或其他类型的建议或推荐。请阅读使用条款了解更多信息。