OPEN-SOURCE SCRIPT
ATR Clouds
*Updated with Version 5*
ATR Clouds
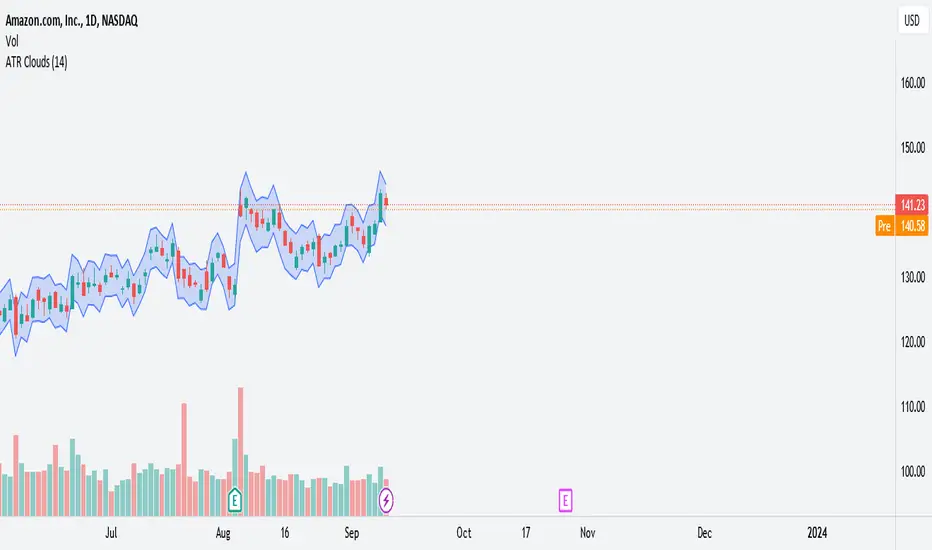
The "ATR Clouds" indicator provides a visual representation of the stock's volatility based on the Average True Range (ATR) calculation. It operates by plotting two bands around the closing price of a stock, using the ATR as a measure of volatility.
Features:
ATR Calculation: The Average True Range is a commonly used metric to understand the volatility of an asset. The indicator calculates the ATR over a user-defined period, with the default being 14 periods.
ATR Bands: Using the ATR value, the script defines two bands:
Upper Band: This is calculated by adding the ATR value to the closing price of the stock. It represents a higher volatility boundary.
Lower Band: This is derived by subtracting the ATR value from the closing price. It indicates a lower volatility boundary.
Cloud Visualization: The space between the upper and lower bands is shaded to create a "cloud" on the chart. This cloud gives traders a clear visual cue of the stock's current volatility range. The cloud has an 80% transparency, allowing the underlying price chart to remain visible.
Customization: Users have the ability to adjust the period for the ATR calculation based on their preferences.
Usage:
Traders can use the ATR Clouds indicator to get a sense of the stock's volatility. Wider clouds indicate periods of higher volatility, while narrower clouds suggest lower volatility. This can be beneficial for se
ATR Clouds
The "ATR Clouds" indicator provides a visual representation of the stock's volatility based on the Average True Range (ATR) calculation. It operates by plotting two bands around the closing price of a stock, using the ATR as a measure of volatility.
Features:
ATR Calculation: The Average True Range is a commonly used metric to understand the volatility of an asset. The indicator calculates the ATR over a user-defined period, with the default being 14 periods.
ATR Bands: Using the ATR value, the script defines two bands:
Upper Band: This is calculated by adding the ATR value to the closing price of the stock. It represents a higher volatility boundary.
Lower Band: This is derived by subtracting the ATR value from the closing price. It indicates a lower volatility boundary.
Cloud Visualization: The space between the upper and lower bands is shaded to create a "cloud" on the chart. This cloud gives traders a clear visual cue of the stock's current volatility range. The cloud has an 80% transparency, allowing the underlying price chart to remain visible.
Customization: Users have the ability to adjust the period for the ATR calculation based on their preferences.
Usage:
Traders can use the ATR Clouds indicator to get a sense of the stock's volatility. Wider clouds indicate periods of higher volatility, while narrower clouds suggest lower volatility. This can be beneficial for se
开源脚本
秉承TradingView的精神,该脚本的作者将其开源,以便交易者可以查看和验证其功能。向作者致敬!您可以免费使用该脚本,但请记住,重新发布代码须遵守我们的网站规则。
免责声明
这些信息和出版物并非旨在提供,也不构成TradingView提供或认可的任何形式的财务、投资、交易或其他类型的建议或推荐。请阅读使用条款了解更多信息。
开源脚本
秉承TradingView的精神,该脚本的作者将其开源,以便交易者可以查看和验证其功能。向作者致敬!您可以免费使用该脚本,但请记住,重新发布代码须遵守我们的网站规则。
免责声明
这些信息和出版物并非旨在提供,也不构成TradingView提供或认可的任何形式的财务、投资、交易或其他类型的建议或推荐。请阅读使用条款了解更多信息。