OPEN-SOURCE SCRIPT
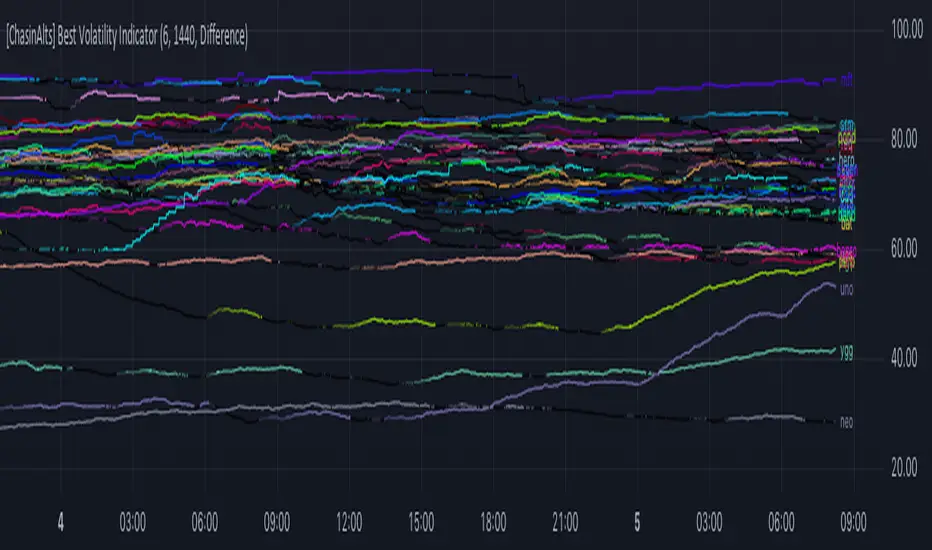
[ChasinAlts] Best Volatility Indicator

I hope you all enjoy this one as it does a great job at finding runners I did try to search for an example script to reference for quite a while when i first dreamt up this idea bc needed assistance implementing it. This script in particular was one that I began long ago but got put on the back-burner because I couldn't figure out how to implement the flow of logic until I came across a library titled 'Conditional Averages' and published by the “Pinecoders" account. Thus, the logic in this code is partially derived from that(https://www.tradingview.com/script/9l0ZpuQU-ConditionalAverages/). To understand what the functions/logic do in the beginning of the 'Functions'' section, you must understand how TV presents it's data through the charts.
Wether on the 1sec TF or the 1day (or ANY other), the only time TV prints a bar/candle is when a trade occurs for that asset (i.e. a change in volume). Even if Open=Close on the same candle, the candle will print with the updated price. The % of candles printed out of the TOTAL possible amount that COULD HAVE been printed is the ultimate output that’s calculated in the script. So, if the lookback setting=10min on the 1min TF and only 7 out of the last 10 candles have printed then the value will appear as 70(%). There are MANY benefits to using this method to measure volatility but its vital to recall that the indicator does nothing to provide the direction of future price movement. One thing I’ve noticed is that when a coin is just beginning it’s ascent and its move is considerably larger/longer than all the other coins OR the plots angle is very steep, it is usually the end of a move and the direction is about to abruptly reverse, continuing with it’s volatility. As volatility increases more and more the plot gets brighter and brighter…and also vise versa.
The settings are as follows:
1) which set of Kucoin’s Margin Coins to use (8 possible sets with 32 coins in each set).
2) input how many minutes ago to start counting the total printed candles from (i.e. if setting is input as 1440, count begins from exactly 24hrs(1440min) ago to present candle.
3) there are 3 different lines to choose from to be able to plot:
i. ‘Includes Open==Close’ = adds to count when bar prints but price does NOT change (=t1)
ii. ‘Does NOT include Open==Close’ = count ONLY updates upon price movement (=t2)
iii. ‘Difference’ = (( t1 - t2 ) / t1 ) *100
*** I’ve got some more great ones I will be uploading soon. Just have to create a description for them
Peace out,
- ChasinAlts
开源脚本
秉承TradingView的精神,该脚本的作者将其开源,以便交易者可以查看和验证其功能。向作者致敬!您可以免费使用该脚本,但请记住,重新发布代码须遵守我们的网站规则。
免责声明
这些信息和出版物并非旨在提供,也不构成TradingView提供或认可的任何形式的财务、投资、交易或其他类型的建议或推荐。请阅读使用条款了解更多信息。
开源脚本
秉承TradingView的精神,该脚本的作者将其开源,以便交易者可以查看和验证其功能。向作者致敬!您可以免费使用该脚本,但请记住,重新发布代码须遵守我们的网站规则。
免责声明
这些信息和出版物并非旨在提供,也不构成TradingView提供或认可的任何形式的财务、投资、交易或其他类型的建议或推荐。请阅读使用条款了解更多信息。