OPEN-SOURCE SCRIPT
RSI Simple and Smooth
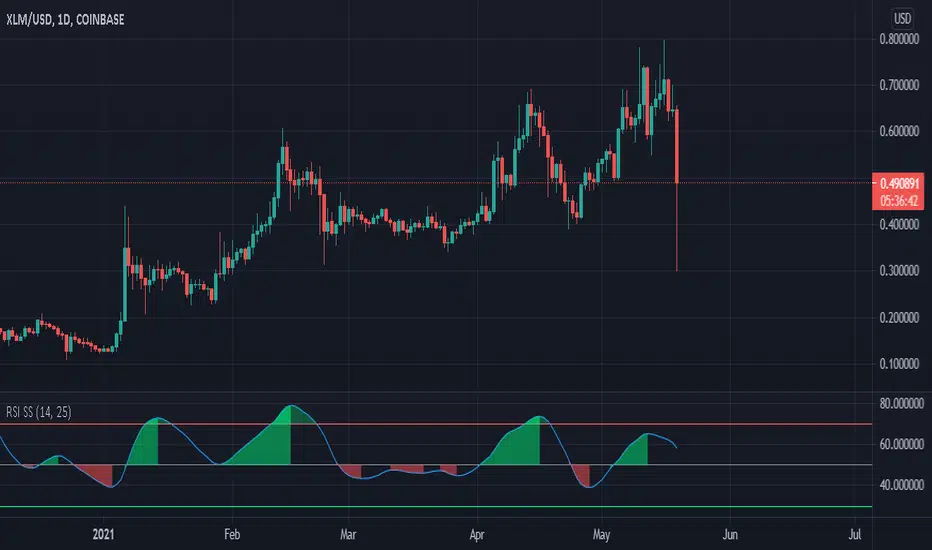
made this RSI for beginners who are annoyed by the jittery signals. Uses a HMA to smooth out the data. I made oversold line green and overbought line red where as the oscillator is green above 50 and red when below 50. This is done intentionally. This is to help remind the user that while there is a downtrend, there is a buy opportunity, and while there is a buy opportunity - there is a downtrend
On the other side, the red overbought line is to remind the user that while there is an uptrend, there is a sell opportunity, and while there is a sell opportunity - there is an uptrend :)
On the other side, the red overbought line is to remind the user that while there is an uptrend, there is a sell opportunity, and while there is a sell opportunity - there is an uptrend :)
开源脚本
秉承TradingView的精神,该脚本的作者将其开源,以便交易者可以查看和验证其功能。向作者致敬!您可以免费使用该脚本,但请记住,重新发布代码须遵守我们的网站规则。
免责声明
这些信息和出版物并非旨在提供,也不构成TradingView提供或认可的任何形式的财务、投资、交易或其他类型的建议或推荐。请阅读使用条款了解更多信息。
开源脚本
秉承TradingView的精神,该脚本的作者将其开源,以便交易者可以查看和验证其功能。向作者致敬!您可以免费使用该脚本,但请记住,重新发布代码须遵守我们的网站规则。
免责声明
这些信息和出版物并非旨在提供,也不构成TradingView提供或认可的任何形式的财务、投资、交易或其他类型的建议或推荐。请阅读使用条款了解更多信息。