PROTECTED SOURCE SCRIPT
Order Imbalance Radar
🧭 Overview
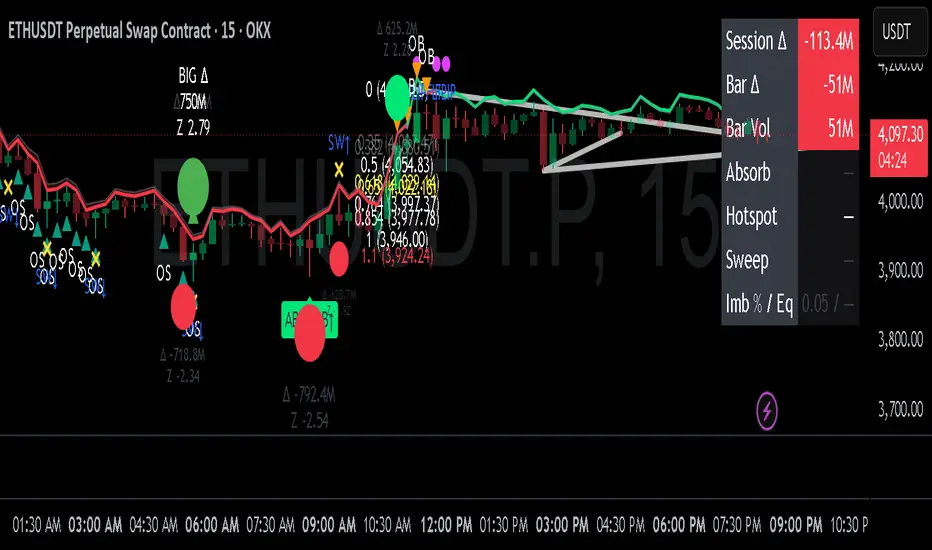
Order Imbalance Radar is a sophisticated volume–flow and imbalance detection system designed to visualize real-time shifts in buyer–seller dominance, absorption events, and market equilibrium. It combines delta-volume analysis, volatility filtering, and orderflow-style signals to help identify high-probability zones of reversal, continuation, or liquidity imbalance.
The indicator includes a top-right analytical dashboard, visual imbalance bubbles, and multiple overlays (absorption, overbought/oversold hotspots, equilibrium ribbon, liquidity sweeps, and session delta tracking).
⚙️ Core Logic & Signal Framework
1. Delta Volume Z-Score Model
Calculates delta (buy vs. sell volume) per bar based on directional close changes.
Uses a z-score normalization of delta over a user-defined lookback (zLookback) to detect statistically significant imbalances.
Highlights two tiers of imbalance:
Normal Imbalance (|z| ≥ zThresh1)
Big Imbalance (|z| ≥ zThresh2)
Filters results by requiring volume ≥ moving average × minVolMul.
Optionally limits signals to volatility squeeze conditions (via Bollinger Band width).
Visual Output:
✅ Green/red bar tints show intensity of buyer/seller imbalance.
🟢/🔴 Circle bubbles with Δ and Z-score values mark detected imbalances.
2. Absorption Detection
Detects bars where price rejects continuation despite high delta extremes, suggesting absorption of aggressive orders by passive liquidity.
Conditions:
|zΔ| exceeds absorbZ threshold
Candle body ≤ % of total range
Opposite wick ≥ % of range
Markers:
🟢 “ABSORB↑” below bars = buyer absorption (sellers absorbed)
🔴 “ABSORB↓” above bars = seller absorption (buyers absorbed)
3. OB/OS Hotspots
Integrates RSI and Bollinger Band positioning to identify volume-confirmed overbought/oversold zones.
Overbought → RSI ≥ rsiOB and price above upper band or high volume.
Oversold → RSI ≤ rsiOS and price below lower band or high volume.
Markers:
🔶 “OB” for overbought zones
🟩 “OS” for oversold zones
These can indicate short-term exhaustion points, particularly when confluenced with imbalance or absorption.
4. Liquidity Sweeps
Identifies stop-hunts / failed breakouts within recent swing lookback:
Sweep Up: Price makes a higher high but closes below previous swing → likely liquidity grab above highs.
Sweep Down: Price makes a lower low but closes above previous swing → liquidity grab below lows.
Markers:
“SW↑” (yellow) = bullish sweep
“SW↓” (yellow) = bearish sweep
5. Equilibrium Map & Ribbon
Analyzes rolling imbalance ratio (Δ / total volume) over a sliding window to gauge market equilibrium vs. imbalance bias.
Plots a dynamic ribbon above price scaled by ATR.
Ribbon color:
🟢 = buyer-dominant imbalance
🔴 = seller-dominant imbalance
Gray band marks the equilibrium zone (|imbalance| ≤ eqBand).
Fuchsia “FLIP” marker signals a change in imbalance polarity.
This provides a macro order-flow bias visualization.
6. Session Dashboard (Top-Right)
Compact dashboard showing real-time flow metrics within a defined trading session (e.g., 09:30–16:00):
Metric Description
Session Δ Total cumulative delta since session start
Bar Δ Current bar delta (buy vs. sell flow)
Bar Vol Bar volume relative to average
Absorb “BUY” / “SELL” / “—”
Hotspot “OB” / “OS” / “—”
Sweep “UP” / “DN” / “—”
Imb % / Eq Imbalance ratio & equilibrium state
Colors dynamically adapt to flow direction (green/red/fuchsia/gray).
7. CumDelta Line
Optional cumulative delta plot for continuous volume-flow tracking.
Helps confirm bias shifts and divergence vs. price.
🧩 Alerts
Pre-built alert conditions for all key events:
Buyer/Seller Imbalances
BIG Buyer/Seller Imbalances
Absorption (Buy/Sell)
Hotspot Overbought/Oversold
Liquidity Sweeps (Up/Down)
Equilibrium Flips
These allow automated alerts for advanced orderflow setups or backtesting triggers.
For More Premium Indicators please visit whop.com/ztcryptolab
受保护脚本
此脚本以闭源形式发布。 但是,您可以自由使用它,没有任何限制 — 在此处了解更多信息。
Make your Money work for you !
Don’t worry — you don’t need to be a pro to start. I’ve got a community and tools that make it super easy to learn and actually understand what’s going on in the markets.
Check it out here 👉 whop.com/ztcryptolab/
Don’t worry — you don’t need to be a pro to start. I’ve got a community and tools that make it super easy to learn and actually understand what’s going on in the markets.
Check it out here 👉 whop.com/ztcryptolab/
免责声明
这些信息和出版物并不意味着也不构成TradingView提供或认可的金融、投资、交易或其它类型的建议或背书。请在使用条款阅读更多信息。