PROTECTED SOURCE SCRIPT
已更新 Mongoose multi time frame RSI quick glance w/alerts
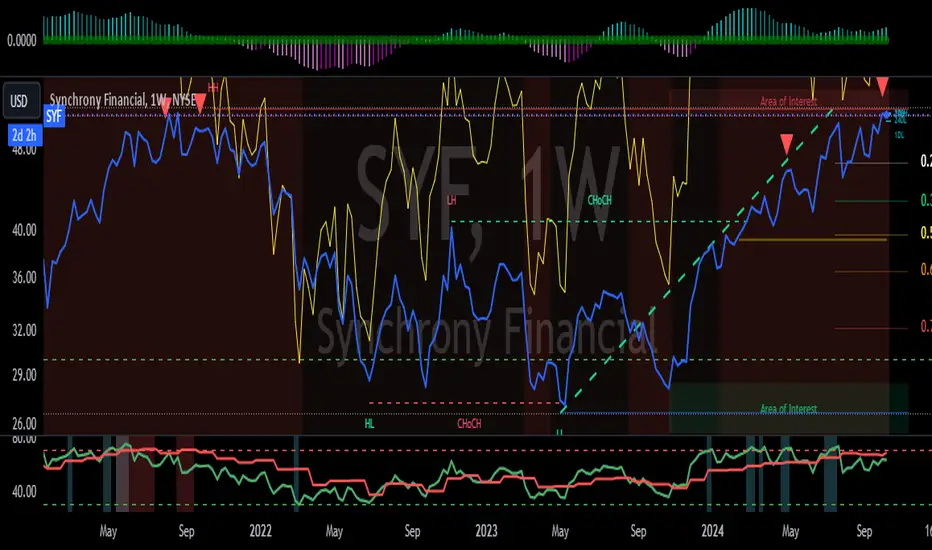
This Pine Script helps you identify overbought and oversold conditions for any stock, index, or cryptocurrency you're monitoring, across three different time frames (daily, weekly, and monthly). It uses the Relative Strength Index (RSI) as the indicator for these conditions. Here’s a breakdown of what the script does and what it tells you:
Key Features:
RSI Indicator:
The script calculates the RSI for three different timeframes: daily, weekly, and monthly.
RSI is a momentum oscillator that measures the speed and change of price movements, typically on a scale from 0 to 100:
Overbought: RSI > 70 (This could indicate the asset is overvalued and may see a price correction).
Oversold: RSI < 30 (This could indicate the asset is undervalued and may see a price rebound).
Color-Coded Background:
The script visually highlights overbought and oversold conditions by coloring the chart background:
Blue for Daily overbought/oversold.
Green for Weekly overbought/oversold.
Red for Monthly overbought/oversold.
Overbought areas will have the colored background whenever the RSI is above 70.
Oversold areas will have the colored background when the RSI drops below 30.
Multiple Timeframes:
The script checks these overbought and oversold levels on three timeframes (daily, weekly, and monthly) simultaneously, giving you a broad view of the market’s momentum.
This helps you determine whether a price movement is part of a short-term fluctuation (daily), a mid-term trend (weekly), or a long-term cycle (monthly).
Alerts:
If the RSI crosses the overbought or oversold threshold for any of these timeframes, the script will trigger an alert.
The alert message includes the name of the stock or cryptocurrency and the timeframe in which the condition occurred (e.g., "Daily Overbought").
How to Use This Information:
Trading Decisions: You can use this script to help decide when to enter or exit trades based on whether an asset is overbought or oversold in different timeframes.
Buy Signal: When RSI is oversold (below 30) and you expect a price rebound.
Sell Signal: When RSI is overbought (above 70) and you expect a price correction.
Long-Term vs Short-Term: By analyzing the three timeframes, you can tailor your strategy to short-term trades (daily RSI) or longer-term investments (weekly or monthly RSI).
In essence, this script gives you a multi-timeframe RSI-based view of potential reversal points in the market, visually coded for clarity, and alerts you when those levels are hit across different timeframes.
版本注释
updated protected script受保护脚本
此脚本以闭源形式发布。 但是,您可以自由使用,没有任何限制 — 了解更多信息这里。
TheRealMongoose
免责声明
这些信息和出版物并非旨在提供,也不构成TradingView提供或认可的任何形式的财务、投资、交易或其他类型的建议或推荐。请阅读使用条款了解更多信息。
受保护脚本
此脚本以闭源形式发布。 但是,您可以自由使用,没有任何限制 — 了解更多信息这里。
TheRealMongoose
免责声明
这些信息和出版物并非旨在提供,也不构成TradingView提供或认可的任何形式的财务、投资、交易或其他类型的建议或推荐。请阅读使用条款了解更多信息。