PROTECTED SOURCE SCRIPT
Integrated Market Analysis Indicator

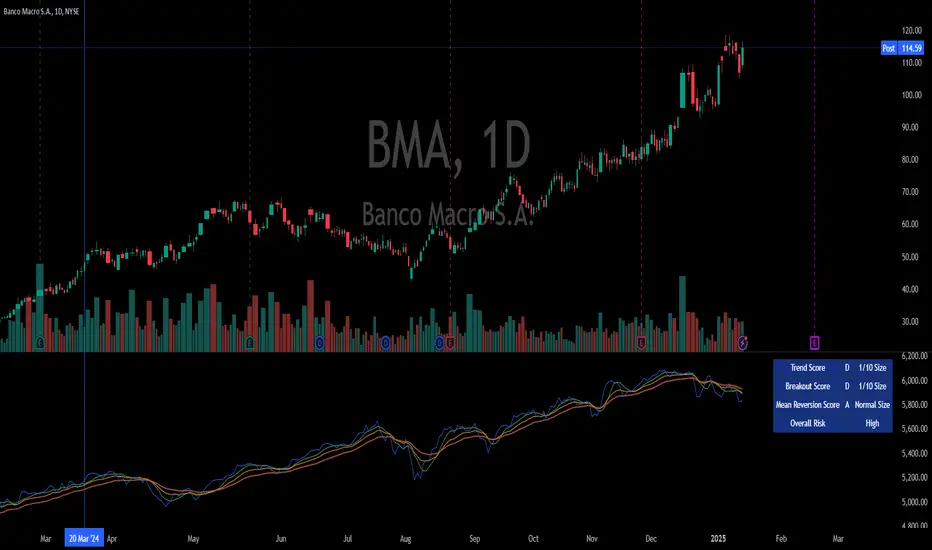
The Integrated Market Analysis Indicator is designed to provide traders with a macro perspective on market conditions, focusing on the S&P 500 (SPX) and market volatility (VIX), to assist in swing trading decisions. This script integrates various technical indicators and market health metrics to generate scores that help in assessing the overall market trend, potential breakout opportunities, and mean reversion scenarios. It is tailored for traders who wish to align their individual stock or index trades with broader market movements.
Functionality:
How to Use the Script:
How NOT to Use the Script:
Logic Explanation:
This indicator should be used as part of a comprehensive trading strategy, providing a macro overlay to your trading decisions, ensuring you're not fighting against the broader market trends or volatility conditions. Remember, while it can guide your trading, always integrate it with other forms of analysis for a well-rounded approach.
Functionality:
- Trend Analysis: The script analyzes the trend of the S&P 500 using moving averages (5-day SMA, 10-day EMA, 20-day EMA) to determine whether the market is in an uptrend, downtrend, or neutral state. This provides a foundation for understanding the general market direction.
- Volatility Assessment: It uses the VIX to gauge market volatility, which is crucial for risk management. The script calculates thresholds based on the 20-day SMA of the VIX to categorize the market volatility into low, medium, or high.
- Market Breadth: The advance/decline ratio (A/D ratio) from the USI:ADVQ and USI:DECLQ indices gives an indication of market participation, helping to understand if the market movement is broad-based or led by a few stocks.
- Scoring System: Three scores are calculated:
Trend Score: Evaluates the market trend in conjunction with volume, market breadth, and VIX to assign a grade from 'A' to 'D'.
Breakout Score: Assesses potential breakout conditions by looking at price action relative to dynamic support/resistance levels, short-term momentum, and volume.
Mean Reversion Score: Identifies conditions where mean reversion might occur, based on price movement, volume, and high VIX levels, indicating potential overbought or oversold conditions. - Risk Management: Position sizing recommendations are provided based on VIX levels and the calculated scores, aiming to adjust exposure according to market conditions.
How to Use the Script:
- Application: Apply this indicator on any stock or index chart in TradingView. Since it uses data from SPX and VIX, the scores will reflect the macro environment regardless of the underlying chart.
- Interpreting Scores:
Trend Score: Use this to gauge the overall market direction. An 'A' score might suggest a strong uptrend, making it a good time for bullish trades, while a 'D' could indicate a bearish environment.
Breakout Score: Look for 'A' scores when considering trades that aim to capitalize on breakouts. A 'B' might suggest a less certain breakout, requiring more caution.
Mean Reversion Score: A 'B' or 'A' here might be a signal to look for trades where you expect the price to revert to the mean after an extreme move. - Risk Management: Use the suggested position sizes ('Normal Size', '1/3 Size', '1/4 Size', '1/10 Size') to manage your risk exposure. Higher VIX levels or lower scores suggest reducing position sizes to mitigate risk.
- Visual Cues: The script plots various SMAs, EMAs, and dynamic support/resistance levels, providing visual indicators of where the market might find support or resistance, aiding in entry and exit decisions.
How NOT to Use the Script:
- Not for Intraday Trading: This indicator is designed for swing trading, focusing on daily or longer timeframes. Using it for intraday trading might not provide the intended insights due to its macro focus.
- Avoid Over-reliance: While the script provides valuable insights, do not rely solely on it for trading decisions. Always consider additional analysis, news, and fundamental data.
- Do Not Ignore Individual Stock Analysis: Although the script gives a macro view, individual stock analysis is crucial. The macro conditions might suggest a trend, but stock-specific factors could contradict this.
- Not for High-Frequency Trading: The script's logic and the data it uses are not optimized for high-frequency trading strategies where microsecond decisions are made.
- Misinterpretation of Scores: Do not misinterpret the scores as absolute signals. They are guidelines that should be part of a broader trading strategy.
Logic Explanation:
- Moving Averages: The script uses different types of moving averages to smooth out price data, providing a clearer view of the trend over short to medium-term periods.
- ATR for Volatility: The Average True Range (ATR) is used to calculate dynamic support and resistance levels, giving a sense of how much price movement can be expected, which helps in setting realistic expectations for price action.
- VIX for Risk: By comparing current VIX levels to its 20-day SMA, the script assesses market fear or complacency, adjusting risk exposure accordingly.
- Market Breadth: The A/D ratio helps to understand if the market movement is supported by a broad base of stocks or if it's narrow, which can influence the reliability of the trend.
This indicator should be used as part of a comprehensive trading strategy, providing a macro overlay to your trading decisions, ensuring you're not fighting against the broader market trends or volatility conditions. Remember, while it can guide your trading, always integrate it with other forms of analysis for a well-rounded approach.
受保护脚本
此脚本以闭源形式发布。 但是,您可以自由使用,没有任何限制 — 了解更多信息这里。
免责声明
这些信息和出版物并非旨在提供,也不构成TradingView提供或认可的任何形式的财务、投资、交易或其他类型的建议或推荐。请阅读使用条款了解更多信息。
受保护脚本
此脚本以闭源形式发布。 但是,您可以自由使用,没有任何限制 — 了解更多信息这里。
免责声明
这些信息和出版物并非旨在提供,也不构成TradingView提供或认可的任何形式的财务、投资、交易或其他类型的建议或推荐。请阅读使用条款了解更多信息。