PROTECTED SOURCE SCRIPT
TRADE ORBIT:-Average Directional Index with Color Zones
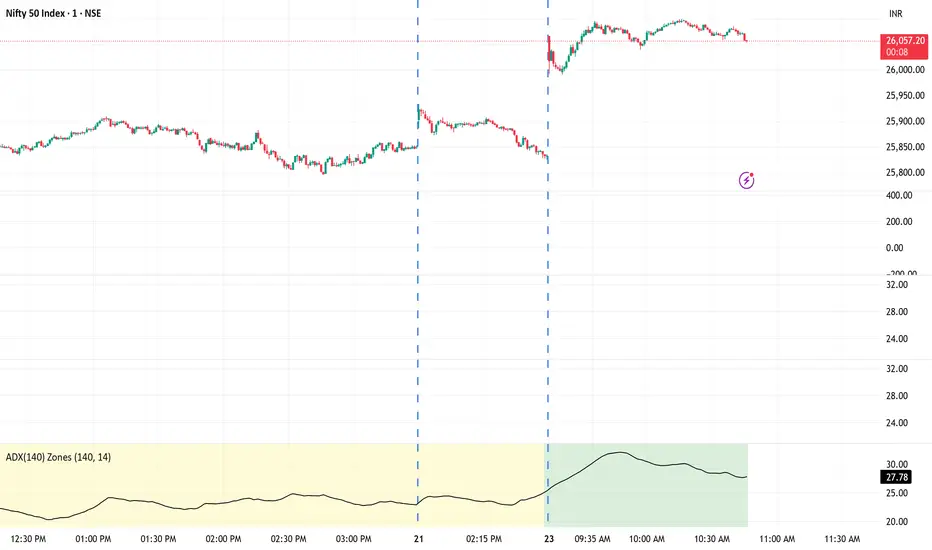
This indicator is a long-term smoothed version of the Average Directional Index (ADX) designed to measure trend strength while filtering out short-term noise.
It applies a 140-period smoothing to the ADX calculation, making it ideal for swing or positional traders who want to identify sustained trends rather than short-lived moves.
🎯 How It Works
The ADX(140) measures the strength of the current trend, regardless of direction.
The background color automatically changes based on the ADX value range to visually highlight the market condition.
ADX Range Background Color Interpretation
0–25 🟡 Yellow Weak trend / ranging market
25–50 🟢 Green Moderate trend strength
50–75 🔵 Blue Strong trend
75–100 🔴 Red Very strong / overheated trend
Horizontal reference lines are also plotted at 0, 25, 50, 75, and 100 to make the trend zones clear.
受保护脚本
此脚本以闭源形式发布。 但是,您可以自由使用它,没有任何限制 — 在此处了解更多信息。
免责声明
这些信息和出版物并不意味着也不构成TradingView提供或认可的金融、投资、交易或其它类型的建议或背书。请在使用条款阅读更多信息。
受保护脚本
此脚本以闭源形式发布。 但是,您可以自由使用它,没有任何限制 — 在此处了解更多信息。
免责声明
这些信息和出版物并不意味着也不构成TradingView提供或认可的金融、投资、交易或其它类型的建议或背书。请在使用条款阅读更多信息。