OPEN-SOURCE SCRIPT
Key Levels (4H and Daily)
Key Levels (4H and Daily)
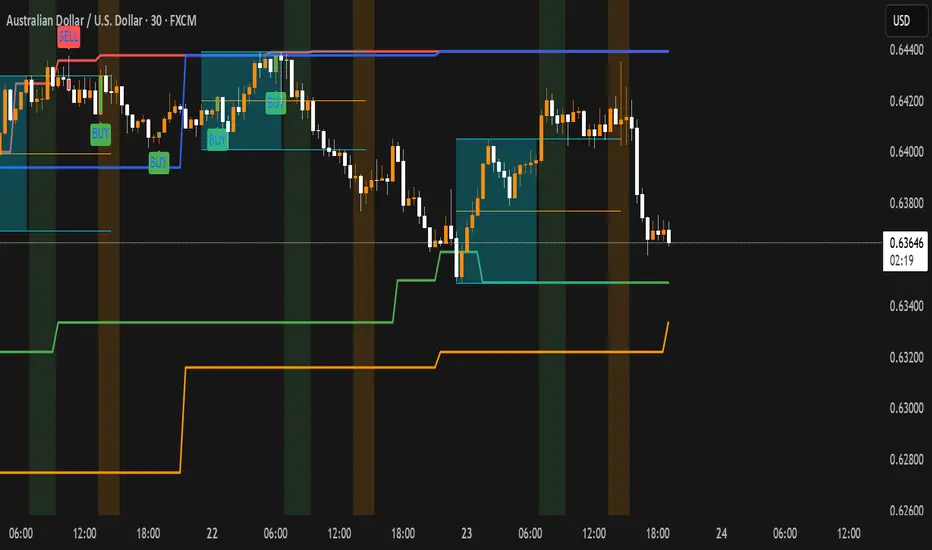
This indicator highlights important key price levels derived from the 4-hour (4H) and daily (D) timeframes, providing traders with critical support and resistance areas. The levels are calculated using the highest highs and lowest lows over a customizable lookback period, offering a dynamic view of significant price points that could influence market movement.
Key Features:
Key Levels for 4H and Daily Timeframes:
The indicator calculates and displays the highest high and lowest low over a user-defined period for both the 4-hour and daily timeframes. This helps traders identify key support and resistance levels that could dictate the market's behavior.
Customizable Lookback Period:
Traders can adjust the lookback period (in days) for both the 4-hour and daily timeframes to reflect different market conditions. This flexibility ensures the levels are tailored to your preferred trading style and market conditions.
Horizontal Lines:
The indicator plots horizontal lines at the high and low levels for both timeframes. These levels serve as dynamic support and resistance areas and help traders monitor price action near these critical points.
Real-Time Updates:
The lines adjust automatically with each new bar, providing up-to-date key levels based on the most recent price action and trading session.
Alert Conditions:
Alerts are built-in to notify traders when the price breaks above or below these key levels. Traders can set up notifications to stay informed when significant market moves occur.
How to Use:
Support and Resistance: Use the levels as potential support and resistance areas where price could reverse. Price often reacts at these levels, providing potential trading opportunities.
Breakouts: Pay attention to breakouts above the high or below the low of these levels. A break above the 4H or daily high could indicate bullish momentum, while a break below could signal bearish trends.
Trend Confirmation: Combine these levels with other technical analysis tools to confirm the overall market trend and enhance your trading strategy.
Perfect for:
Day Traders: Use the 4-hour levels for intraday trading setups, such as potential reversals or breakouts.
Swing Traders: The daily levels provide longer-term insights, helping to identify key zones where price might pause, reverse, or break out.
Market Context: Ideal for those who want to contextualize their trades within broader timeframes, helping to understand the market’s structure at multiple time scales.
This description conveys the utility and functionality of the indicator, focusing on how it helps traders identify and monitor key levels that influence market action.
开源脚本
秉承TradingView的精神,该脚本的作者将其开源,以便交易者可以查看和验证其功能。向作者致敬!您可以免费使用该脚本,但请记住,重新发布代码须遵守我们的网站规则。
免责声明
这些信息和出版物并非旨在提供,也不构成TradingView提供或认可的任何形式的财务、投资、交易或其他类型的建议或推荐。请阅读使用条款了解更多信息。
开源脚本
秉承TradingView的精神,该脚本的作者将其开源,以便交易者可以查看和验证其功能。向作者致敬!您可以免费使用该脚本,但请记住,重新发布代码须遵守我们的网站规则。
免责声明
这些信息和出版物并非旨在提供,也不构成TradingView提供或认可的任何形式的财务、投资、交易或其他类型的建议或推荐。请阅读使用条款了解更多信息。