OPEN-SOURCE SCRIPT
已更新 TNT_Upgraded
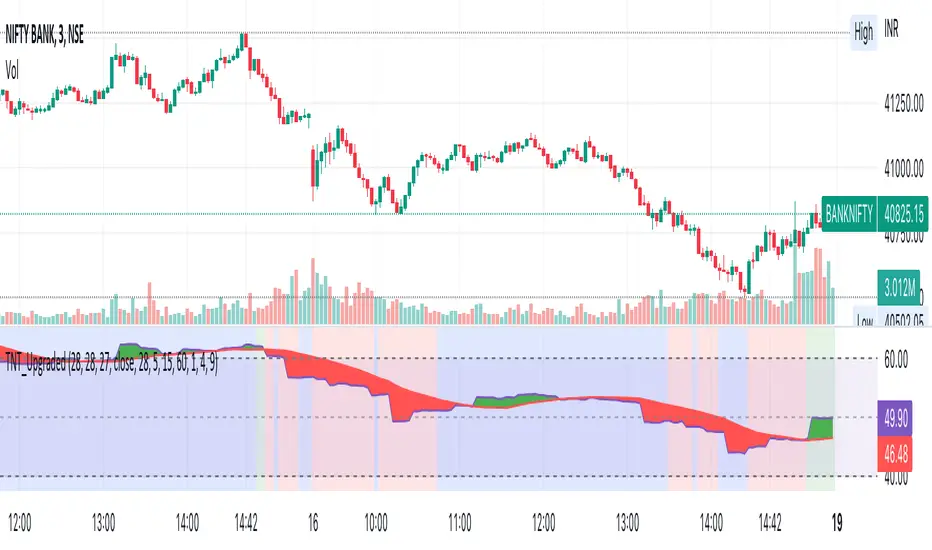
The background of the indicator to show TrendingUp (Green) / TrendingDown (Red) / Range Bound (Blue) Regions.
The concept is very simple, at each candle we look at the size of the candle and use a moving average of these candle body size (ABS (close-open)) and compare it agains a double smoothened average, i.e. moving average of this average to find trending or not trending periods.
In the upgrade the moving average is now looking only at the current day for intraday timeframe, i.e. in the first 5 bars it is an average of last 5 values, for last 10 candles it is an average of 10 values with the max limited to 28 that is for candle 28 onwards the average is always for 28 candles for default values or as defined by user.
I find it useful primarily for entry in options, a green background is more favourable for call option buying, a red background is favourable for put option buying and blue background is more favourable for option selling.
The coloured ranges show the direction bias, this has been designed using RSI on 3 timeframes with different weight-ages, all customisable by the user.
PS, I only trade Bank Nifty for intraday, all my observations are driven only by Bank Nifty.
版本注释
Minor code changes开源脚本
秉承TradingView的精神,该脚本的作者将其开源,以便交易者可以查看和验证其功能。向作者致敬!您可以免费使用该脚本,但请记住,重新发布代码须遵守我们的网站规则。
免责声明
这些信息和出版物并非旨在提供,也不构成TradingView提供或认可的任何形式的财务、投资、交易或其他类型的建议或推荐。请阅读使用条款了解更多信息。
免责声明
这些信息和出版物并非旨在提供,也不构成TradingView提供或认可的任何形式的财务、投资、交易或其他类型的建议或推荐。请阅读使用条款了解更多信息。