OPEN-SOURCE SCRIPT
Sine Wave
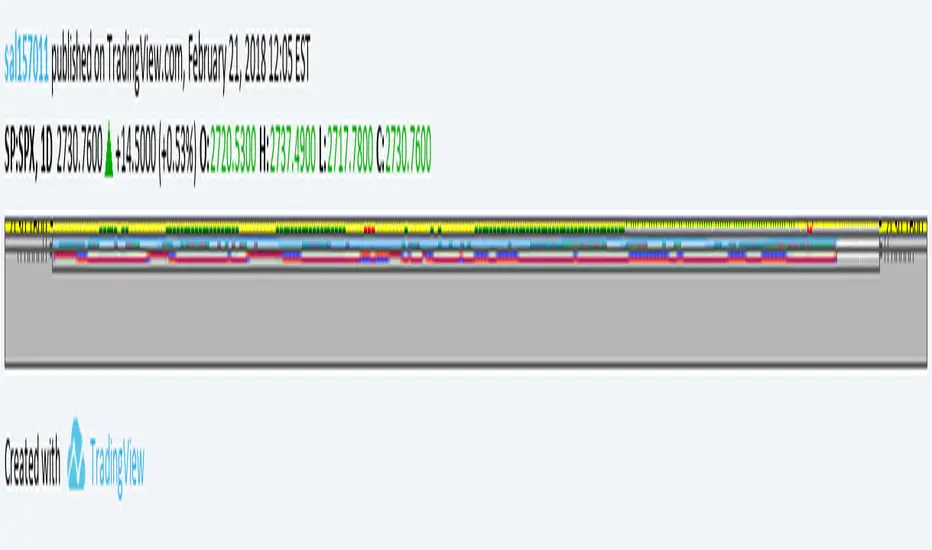
This is John F. Ehlers, Hilbert Sine Wave with barcolor and bgcolor.
When fast line red crosses down slow line blue that is a zone of resistance in the price chart, and when fast line crosses up slow line blue that is a zone of support.
When close of the bar is equal or greater than the zone of resistance there is a trend up mode in place and trending instruments like Hull moving average should be used, and when the close of the bar is equal or greater than the zone of resistance there is a trend down in place and trending instruments should be used too.
When none of the preceeding conditions are valid there is a cycle mode, and cycle instruments like oscillators, stochastics and the Sine Wave itself should be used. Note that the Sine Wave is almost always a leading indicator when in a cycle mode.
Barcolor and bgcolor mean: Green = Trend Up , Red = Trend Down, Yellow= Cycle mode
开源脚本
秉承TradingView的精神,该脚本的作者将其开源,以便交易者可以查看和验证其功能。向作者致敬!您可以免费使用该脚本,但请记住,重新发布代码须遵守我们的网站规则。
免责声明
这些信息和出版物并非旨在提供,也不构成TradingView提供或认可的任何形式的财务、投资、交易或其他类型的建议或推荐。请阅读使用条款了解更多信息。
免责声明
这些信息和出版物并非旨在提供,也不构成TradingView提供或认可的任何形式的财务、投资、交易或其他类型的建议或推荐。请阅读使用条款了解更多信息。