OPEN-SOURCE SCRIPT
Ichimoku Bollinger Bands
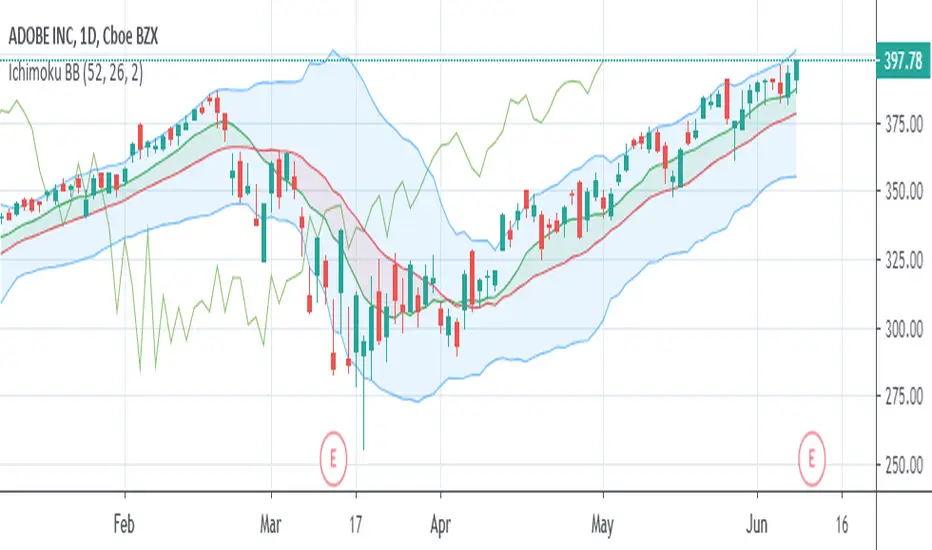
This indicator is a standard set of Bollinger Bands with some functionality borrowed from Ichimoku Kinko Hyo. There's an added SMA (9) that gets shaded green when it's above the basis line of the Bollinger Bands (SMA 20) and turns red when it falls below. No, it's not remotely where the Ichimoku Cloud would appear, but it's a decent trend indicator regardless.
You also get Ichimoku's Lagging Span to help verify the strength of the trend. When the Lagging Span rises above the price history, the trend is up. When the Lagging Span rises above the Bollinger Bands, the uptrend is super strong. And the opposite conditions signal downtrends.
You also get Ichimoku's Lagging Span to help verify the strength of the trend. When the Lagging Span rises above the price history, the trend is up. When the Lagging Span rises above the Bollinger Bands, the uptrend is super strong. And the opposite conditions signal downtrends.
开源脚本
秉承TradingView的精神,该脚本的作者将其开源,以便交易者可以查看和验证其功能。向作者致敬!您可以免费使用该脚本,但请记住,重新发布代码须遵守我们的网站规则。
免责声明
这些信息和出版物并非旨在提供,也不构成TradingView提供或认可的任何形式的财务、投资、交易或其他类型的建议或推荐。请阅读使用条款了解更多信息。
免责声明
这些信息和出版物并非旨在提供,也不构成TradingView提供或认可的任何形式的财务、投资、交易或其他类型的建议或推荐。请阅读使用条款了解更多信息。