OPEN-SOURCE SCRIPT
RSI %b Signal [H1 Backtesting]
-----------------------------------------------------------------
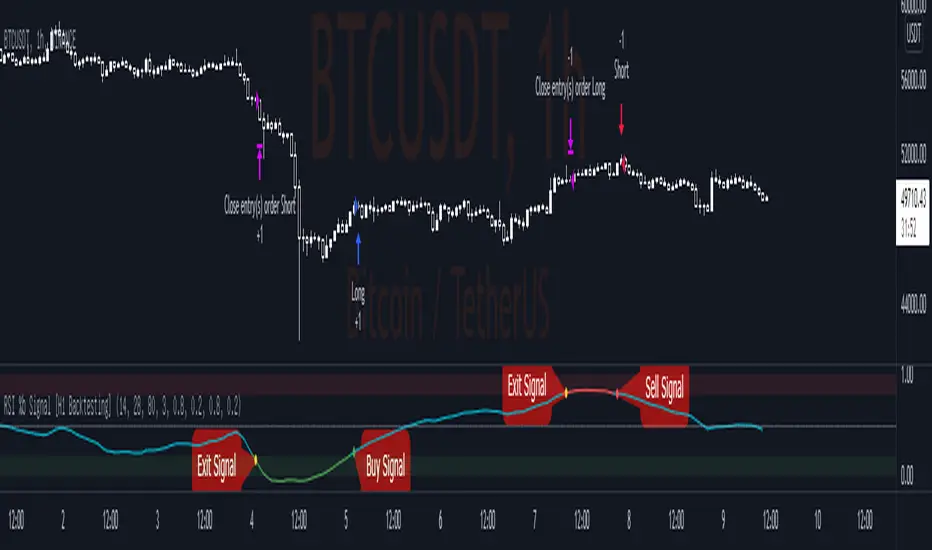
This simple strategy base on RSI, EMA, Bollinger Bands to get Buy and Sell Signal with detail as below:
-----------------------------------------------------------------
1.Define Oscillator Line
+ Oscillator Line is smoothed by ema(28) of RSI(14) on H1 Timeframe
2.Define Overbought and Oversold
+ Apply Bollinger Bands BB(80,3) on Oscillator Line and calculate %b
+ Overbought Zone marked above level 0.8
+ Oversold Zone marked below level 0.2
3.Buy Signal
+ Entry Long Position when %b crossover Point of Entry Long
+ Deafault Point of Entry Long is 0.2
+ Buy signal marked by Green dot
4.Sell Signal
+ Entry Short Position when %b crossunder Point of Entry Short
+ Deafault Point of Entry Short is 0.8
+ Sell signal marked by Red dot
5.Exit Signal
+ Exit Position (both Long and Short) when %b go into Overbought Zone or Oversold Zone
+ Exit signal marked by Yellow dot
-----------------------------------------------------------------
开源脚本
秉承TradingView的精神,该脚本的作者将其开源,以便交易者可以查看和验证其功能。向作者致敬!您可以免费使用该脚本,但请记住,重新发布代码须遵守我们的网站规则。
免责声明
这些信息和出版物并非旨在提供,也不构成TradingView提供或认可的任何形式的财务、投资、交易或其他类型的建议或推荐。请阅读使用条款了解更多信息。
免责声明
这些信息和出版物并非旨在提供,也不构成TradingView提供或认可的任何形式的财务、投资、交易或其他类型的建议或推荐。请阅读使用条款了解更多信息。