PROTECTED SOURCE SCRIPT
已更新 Daily Fractals
Custom Timeframe Candles - Fractal Analysis Tool
📊 Overview
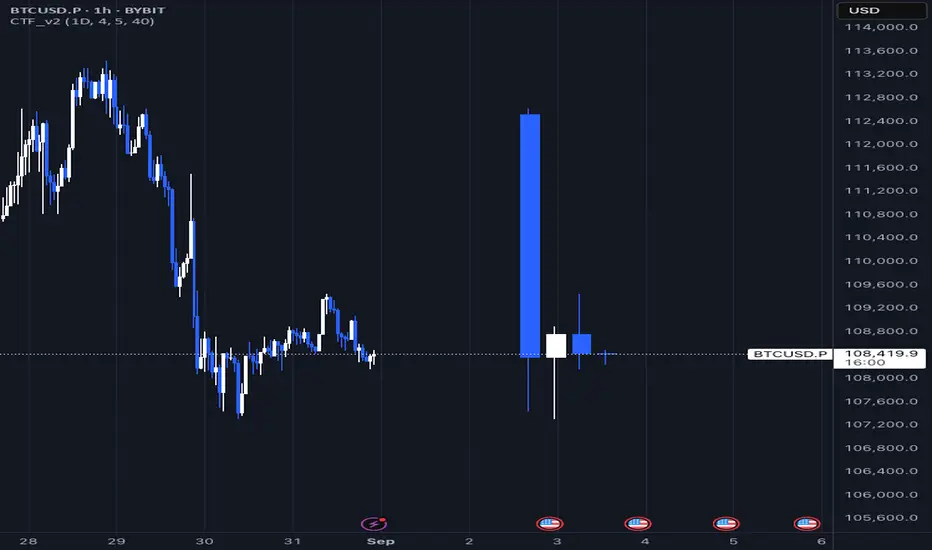
Custom Timeframe Candles is a powerful Pine Script indicator that displays higher timeframe (HTF) candles directly on your current chart, enabling seamless fractal analysis without switching between timeframes.
Perfect for traders who want to analyze daily candles while trading on hourly charts, or any other timeframe combination.
✨ Key Features
🎯 Multi-Timeframe Analysis
- Display any higher timeframe candles on your current chart
- Real-time updates of the current HTF candle as price moves
- Configurable number of candles (1-10) to display
🎮 How to Use
1. Add to Chart: Apply the indicator to any timeframe chart
2. Select HTF: Choose your desired higher timeframe (e.g., "1D" for daily)
3. Configure Display: Set number of candles, colors, and position
4. Analyze: View HTF context while trading on lower timeframes
📈 Perfect For Backtest
Unlike basic HTF displays, this indicator provides:
- Live Updates: Current candle updates in real-time
- Complete OHLC: Full candle structure with wicks
- Flexible Count: Display exactly what you need
- Stable Performance: No crashes during replay/backtesting
- Professional Design: Clean, customizable appearance
📝 Notes
- Works on all timeframes and instruments
- Requires higher timeframe data availability
- Compatible with replay mode and backtesting
---
by Rock9808
📊 Overview
Custom Timeframe Candles is a powerful Pine Script indicator that displays higher timeframe (HTF) candles directly on your current chart, enabling seamless fractal analysis without switching between timeframes.
Perfect for traders who want to analyze daily candles while trading on hourly charts, or any other timeframe combination.
✨ Key Features
🎯 Multi-Timeframe Analysis
- Display any higher timeframe candles on your current chart
- Real-time updates of the current HTF candle as price moves
- Configurable number of candles (1-10) to display
🎮 How to Use
1. Add to Chart: Apply the indicator to any timeframe chart
2. Select HTF: Choose your desired higher timeframe (e.g., "1D" for daily)
3. Configure Display: Set number of candles, colors, and position
4. Analyze: View HTF context while trading on lower timeframes
📈 Perfect For Backtest
Unlike basic HTF displays, this indicator provides:
- Live Updates: Current candle updates in real-time
- Complete OHLC: Full candle structure with wicks
- Flexible Count: Display exactly what you need
- Stable Performance: No crashes during replay/backtesting
- Professional Design: Clean, customizable appearance
📝 Notes
- Works on all timeframes and instruments
- Requires higher timeframe data availability
- Compatible with replay mode and backtesting
---
by Rock9808
版本注释
remove debug版本注释
Remove debugging option版本注释
Published something受保护脚本
此脚本以闭源形式发布。 但是,您可以自由使用,没有任何限制 — 了解更多信息这里。
免责声明
这些信息和出版物并非旨在提供,也不构成TradingView提供或认可的任何形式的财务、投资、交易或其他类型的建议或推荐。请阅读使用条款了解更多信息。
免责声明
这些信息和出版物并非旨在提供,也不构成TradingView提供或认可的任何形式的财务、投资、交易或其他类型的建议或推荐。请阅读使用条款了解更多信息。